
Understanding your GoGreen monthly targets
How the yearly sustainability goal becomes monthly targets, what happens once a month is over, and why one month can show more than one number.
The yearly goal, in plain terms
Think of your energy goal as a household budget. In its base year, our example hotel used 20.80 kWh for every guest night. It committed to reducing this by 17% by 2030, and on the straight path towards that promise, the allowance for 2026 is 19.29 kWh per guest night. Multiplied by the roughly 337,000 guest nights forecast for the year, this gives the hotel a yearly energy budget of about 6.5 million kWh.
That budget is then divided across the twelve months – not equally, but following your expected business pattern: busy months receive a larger share, quiet months a smaller one. The result is a concrete kWh target for every month of the year.
What happens when a month is over
Once a month closes, its planned target is never changed – but you will see two different numbers for it, on purpose, in two different places:
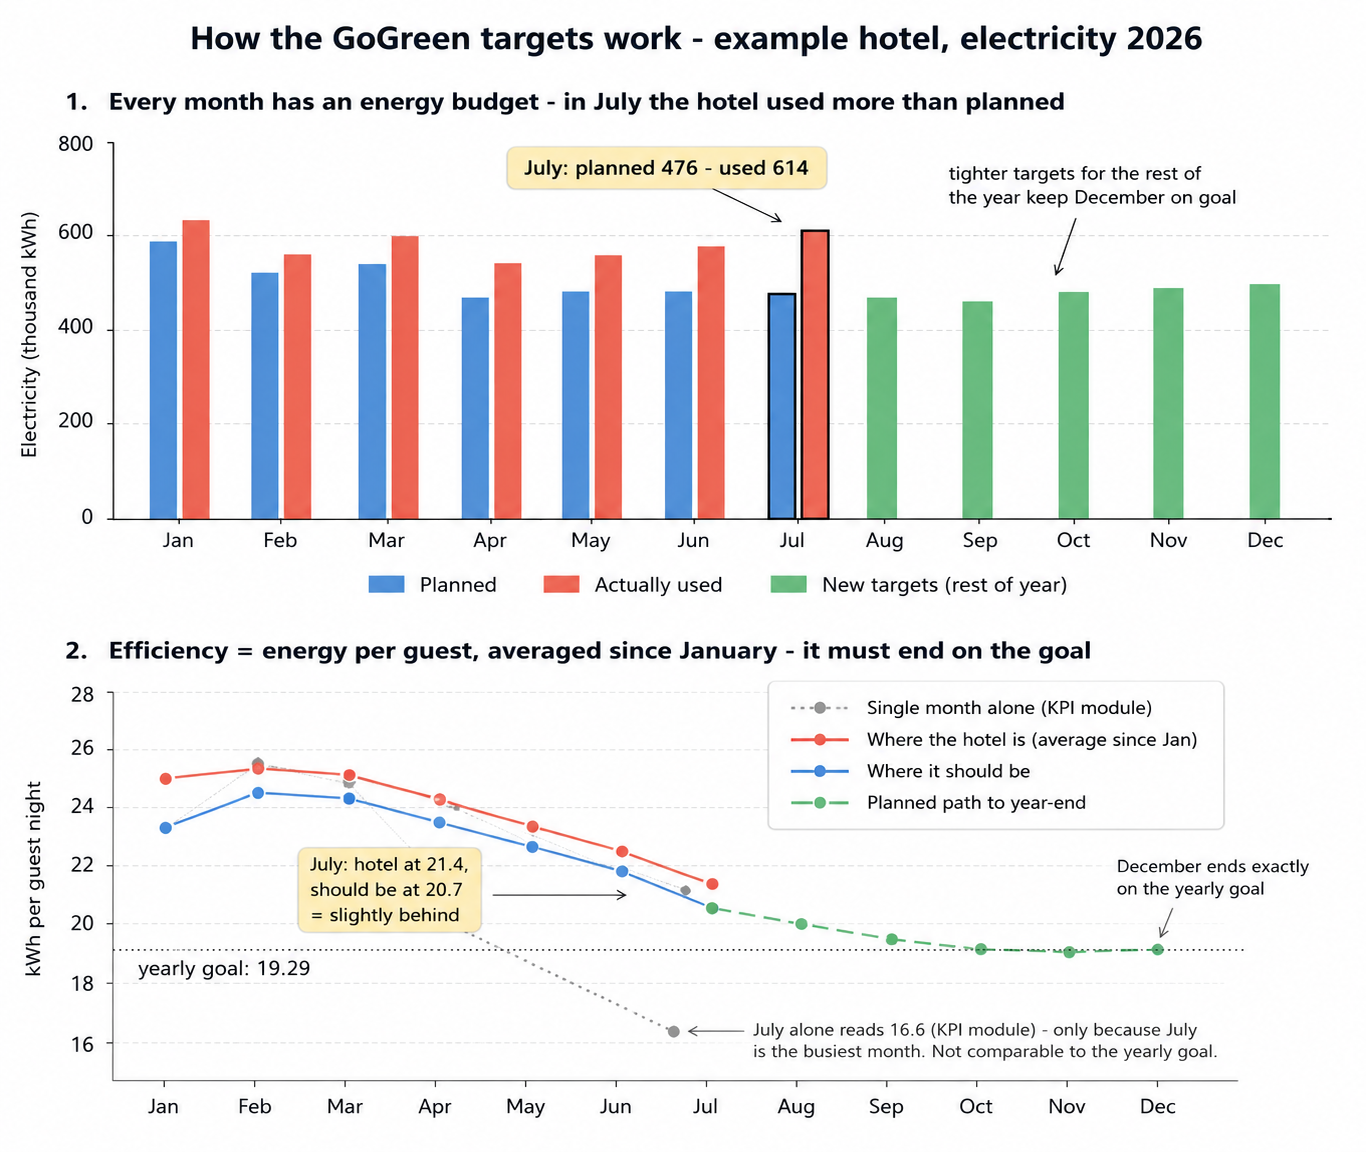
- In reports and the learning view, the month keeps its original plan. For July, that plan was 476,247 kWh. Like a diary entry, it records what the hotel was supposed to consume, and it is never edited afterwards.
- In the cockpit chart, the target line for a finished month shows what actually happened – 614,262 kWh in July. Once a month is history, the chart shows reality rather than an outdated plan.
- Both numbers are correct; they answer different questions. “What was the plan?” – look at the report. “What happened?” – look at the cockpit.
If the hotel consumes more than planned – as here, 29% over in July – the system automatically tightens the targets of the remaining months of the year, so that December still lands exactly on the yearly goal. The past is never rewritten; the future absorbs the difference.
The efficiency figure (kWh per guest night)
The kWh-per-guest-night figure you see for a month is a running average since January, not the month alone. A busy July naturally looks very efficient on its own, so a single-month view would be misleading; the running average keeps the picture honest.
For a finished month, the system’s target line combines what really happened in the earlier months with that month’s own plan. In our July example: actual consumption January to June, plus July’s planned 476,247 kWh, divided by all guest nights since January – giving a target of 20.72 kWh per guest night. The hotel’s real running average was 21.44, so it was about 3.5% above target at that point.
If you divide a single month’s consumption by its own guest nights – as the KPI module shows for the individual month – you will get a different, often much lower figure. July alone: 614,262 kWh / 37,096 guest nights = 16.6 kWh per guest night. That number is real, but it mostly reflects how busy the month was, not how efficiently the hotel ran: July’s peak occupancy spreads the hotel’s fixed consumption (lobby, kitchen, ventilation) over the largest possible number of guests. By that measure, the month that exceeded its consumption budget by 29% would look like the most efficient month of the year – which is exactly why GoGreen always evaluates efficiency as the average since January.
| July’s efficiency figure | Calculation | What it tells you |
|---|---|---|
| 16.6 kWh/GN (KPI module, single month) | July kWh / July guest nights | How busy July was – peak occupancy dilutes the fixed base load |
| 21.44 kWh/GN (cockpit, running average) | Jan-Jul kWh / Jan-Jul guest nights | How efficiently the hotel is running this year – compare this to the target of 20.72 |
Why the two targets can disagree
It is perfectly possible – and quite common – to be over the consumption target and under the per-guest-night target in the same month. The reason: consumption measures volume, the per-guest-night figure measures efficiency, and guest nights sit on opposite sides of the equation.
The consumption target was built from the forecast: allowed kWh per guest night times the guest nights expected. If the hotel then welcomes more guests than forecast, total consumption naturally rises above that plan – more rooms serviced, more showers, more breakfasts. But every additional guest night also enlarges the divisor of the efficiency figure, pulling it down. A mini example:
| Planned | Actual | |
|---|---|---|
| Guest nights | 10,000 | 11,500 |
| Consumption | 192,900 kWh | 210,000 kWh (9% over) |
| kWh per guest night | 19.29 | 18.26 (5% under) |
Both statements are true at once: the hotel used more energy than planned and ran more efficiently than required. And that is the fair verdict – the extra consumption came from extra business, not from waste. It also works because much of a hotel’s energy use is fixed: lobby, kitchen, pool and ventilation run whether the house is full or not, so additional guests add only a little consumption each while fully counting in the divisor. The same logic in reverse explains why a very quiet month can consume less than ever and still miss the efficiency target: the fixed base load is spread over too few guests.
The practical rule: when the two targets disagree, first compare actual guest nights with the forecast. More guests than forecast makes “over on consumption, under on efficiency” the expected, healthy pattern. If guest nights were on forecast and both figures are over – as in our July example – it is genuine over-consumption, and the conversation is about operations, not about the calculation.
July 2026 at a glance
| Question | Number | Where you see it | What it means |
|---|---|---|---|
| What was July’s plan? | 476,247 kWh | Reports / learning view | The frozen monthly target |
| What did July consume? | 614,262 kWh | Cockpit (actual & target line) | Reality – 29% over plan |
| Where should the hotel stand by July? | 20.72 kWh/GN | Cockpit efficiency target | Running average: actuals to June + July’s plan |
| Where does it actually stand? | 21.44 kWh/GN | Cockpit efficiency actual | Running average of actual consumption |
| What was July alone? | 16.6 kWh/GN | KPI module (single month) | July kWh / July guests – reflects peak occupancy, not comparable to the goal |
| Where must December land? | 19.29 kWh/GN | Yearly goal | Guaranteed by tightening Aug-Dec targets |
Good to know
Targets are recalculated automatically at the start of each month and whenever forecasts change – but only the current and future months move. Finished months are final.
A finished month’s efficiency figure above the yearly goal is not automatically a problem: the average starts high in quiet months and converges towards the goal as the year progresses. What matters is the gap between the actual line and the target line.
If you export data, note that learning exports show consumption in MWh (thousands of kWh), while the cockpit displays kWh.
-
Getting started
-
-
- Arrivals/Departures
- Data elements required from PMS
- Manual Export PMS – Fidelio
- How to do a manual PMS export from Opera
- Manual Export PMS – Picasso
- Manual Export PMS – Protel
- Manual Export PMS – Spirit Web
- PMS – Cenium
- PMS – Citybreak
- PMS – Fidelio
- PMS – Opera
- PMS – Protel
- How to do a manual PMS export from HotSoft
- PMS – Skidata
- How to set up an Opera reports export
- PMI API
- PMI API Best Practice Get Forecasted hours
- PMI File Agent setup and documentation
- Technical specification for data integration
- How to transfer data to PMI
- How to enable Opera Cloud reports
- PMI system integration overview
- Opera Scheduler setup - Reservation Statistics 1
- Opera Scheduler setup - Report Trial Balance (trial_balance)
- Opera Scheduler setup - Reservation Forecast, (res_forecast)
- Opera Scheduler setup - Reservation History & Forecast (history_forecast)
- Opera Scheduler setup - Daily Forecast Report
- Opera Scheduler setup - SFTP transfer guide
- Manual Export PMS Opera
- Report 1 (manual export): Reservation Statistics 1 (res_statistics1)
- Report 2 (manual export): Reservation Forecast, (res_forecast)
- Report 3 (manual export): Trial Balance (trial_balance)
- Report 4 (manual export): Reservation History & Forecast (history_forecast)
- Show all articles ( 4 ) Collapse Articles
-
- Understanding Productivity in Hospitality (and Why It Matters in PMI)
- How Forecasting Drives Productivity in Hotels
- The Most Important Productivity KPIs in Hospitality
- The Hotel Productivity Management Cycle
- Hospitality Productivity and PMI – Quick overview
- Balancing Productivity, Cost Control, and Guest Service in Hotels
-
Video tutorials
-
- Administration Labor cockpit [14:49]
- Bar and Pub Labor cockpit [12:21]
- Breakfast Labor cockpit [12:05]
- Consolidated view in Benchmarking and Management Perspective [3:20]
- Flash Report Onboarding [6:27]
- Flash report overview [2:25]
- Food cost cockpit [6:21]
- Kitchen Labor cockpit [11:28]
- Labor Cockpit Onboarding [18:16]
- Labor cockpit overview [3:12]
- Live forecast 1/5 navigation [5:05]
- Live Forecast 2/5 Rooms [5:05]
- Live forecast 3/5 meeting & event [5:40]
- Live forecast 4/5 food & beverage [6:11]
- Live forecast 5/5 breakfast [7:19]
- Live forecast onboarding [6:06]
- Live forecast overview [2:58]
- Management perspective overview [3:06]
- P&L Planning 1/10 Purpose and benefits [2:25]
- P&L Planning 10/10 How to approve forecast and budget or target [2:34]
- P&L Planning 2/10 Navigation [4:26]
- P&L Planning 3/10 How to build a total [4:29]
- P&L Planning 4/10 Three ways of inserting figures [4:32]
- P&L Planning 5/10 How to add a sub account [1:42]
- P&L Planning 6/10 How to build a constant [2:42]
- P&L Planning 7/10 Staff module [2:48]
- P&L Planning 8/10 How to add a staff member [1:33]
- P&L Planning 9/10 How to revise and submit a forecast [3:01]
- Repair and Maintenance Labor cockpit [13:01]
- Restaurant Labor cockpit [12:30]
- Schedule 1/8 Navigation [5:12]
- Schedule 2/8 How to create a labor cockpit schedule [4:29]
- Schedule 3/8 How to add a team member [2:07]
- Schedule 4/8 How to create a shift code [3:30]
- Schedule 5/8 How to add shift codes to team members [3:41]
- Schedule 6/8 How to create a rotating schedule [3:20]
- Schedule 7/8 How to replace shift codes for a period [2:00]
- Schedule 8/8 How to create split shifts between departments [2:42]
- Stewarding Labor cockpit [11:38]
- Timesheet Onboarding [4:14]
- Show all articles ( 25 ) Collapse Articles
-
- Articles coming soon
-
- Administration Labor cockpit [14:49]
- Bar and Pub Labor cockpit [12:21]
- Breakfast Labor cockpit [12:05]
- Food cost cockpit [6:21]
- Front office Labor cockpit [12:05]
- Housekeeping Labor cockpit [11:20]
- Kitchen Labor cockpit [11:28]
- Labor Cockpit Onboarding [18:16]
- Labor cockpit overview [3:12]
- Repair and Maintenance Labor cockpit [13:01]
- Restaurant Labor cockpit [12:30]
- Schedule 1/8 Navigation [5:12]
- Schedule 2/8 How to create a labor cockpit schedule [4:29]
- Schedule 3/8 How to add a team member [2:07]
- Schedule 4/8 How to create a shift code [3:30]
- Schedule 5/8 How to add shift codes to team members [3:41]
- Schedule 6/8 How to create a rotating schedule [3:20]
- Schedule 7/8 How to replace shift codes for a period [2:00]
- Schedule 8/8 How to create split shifts between departments [2:42]
- Stewarding Labor cockpit [11:38]
- Timesheet Onboarding [4:14]
- Show all articles ( 6 ) Collapse Articles
-
- How to edit a plan [3:52]
- P&L Planning 1/10 Purpose and benefits [2:25]
- P&L Planning 10/10 How to approve forecast and budget or target [2:34]
- P&L Planning 2/10 Navigation [4:26]
- P&L Planning 3/10 How to build a total [4:29]
- P&L Planning 4/10 Three ways of inserting figures [4:32]
- P&L Planning 5/10 How to add a sub account [1:42]
- P&L Planning 6/10 How to build a constant [2:42]
- P&L Planning 7/10 Staff module [2:48]
- P&L Planning 8/10 How to add a staff member [1:33]
- P&L Planning 9/10 How to revise and submit a forecast [3:01]
-
- Articles coming soon
-
-
Onboarding
-
- Onboarding roles overview
- Onboarding roles – Breakfast
- Onboarding roles – Finance
- Onboarding roles – Food cost
- Onboarding roles – Front Office
- Onboarding roles – Housekeeping
- Onboarding roles – Kitchen
- Onboarding roles – Restaurant and Meeting & Event
- Onboarding roles – Stewarding
- Onboarding roles – Repair and Maintenance
- GM Introduction to PMI
- Onboarding roles – Bar and Pub
- Onboarding roles – Administration
-
-
GM's corner
-
PMI homepage
-
PMI planning
-
- How to work with Rooms Budget and forecast
- How to work with non-rooms Budget and forecast
- Use Forecast/Budget hours from Cockpit in P&L Staff module
- How to input a budget in PMI
- Setting productivity targets in PMI
- Express planner overview
- How to run Express planner
- How to configure Express planner settings
- Express planner calculation explanation with examples
- Compiling revenue streams overview
- How to manually enter a revenue budget in PMI
- How to enter a revenue budget in PMI using Live forecast data
- How to enter a revenue budget in PMI using the Data Upload Centre
- How to set monthly labor productivity and hour targets in PMI
- Arrivals, departures, and stay over visibility
- P&L planning automation - how the system calculates your planning schedule
- Plan version automation - Never miss budget season again
- How to set up automated planning cycles
- Show all articles ( 3 ) Collapse Articles
-
- Room revenue Planning: Calculations explanation
- Labor planning: How to edit
- Overview of GoGreen Planning
- How to set up GoGreen planning for a chain or property
- Navigation and filters in NextGen planning page: explanation with examples
- Sense check mode in new planning pages explained
- How to edit a GoGreen plan
-
- Accounts overview
- How to populate and edit accounts
- How to approve a forecast or budget in PMI
- How to copy from reference
- How to edit and update using the staffing tool
- How to make a profit forecast
- How to set up a weekly Live forecast
- How to add a comparison year in P&L
- How to modify a P&L report
- Planning Menu – Tools and View Options overview
- Planning staff module overview
- How to build a P&L planning report
- How to add staff and manage staff cost
- Staffing screen overview
- How to input a budget in PMI
- PMI Planning module overview
- How to add a Food & beverage revenue forecast in P&L Planning
- How to add room revenue in Planning
- Constants explained: how they work in PMI Planning
- Auto-populate P&L Staff hours and rates from Budget & forecast
- Profit & Loss staff – Copy hours and rates to cockpit
- How to use Constants/Planning assumptions in P&L formulas
- Show all articles ( 7 ) Collapse Articles
-
-
Cockpit
-
- Labor cockpit overview
- Labor Cockpit Preparations
- Labor cockpit cost driver
- SMART forecast explained
- How does SMART allocate daily hours?
- Using arrivals and departures as a cost driver
- Closing Profit Center or Cockpit
- How to work with labor cost
- Min/Max explanation
- Parent and sub-cockpits explained
- Staffing guide explained
- Daily and weekly routines for department heads
- Understanding the importance of including outsourced labor hours in PMI
- How to add labor cost in PMI
- Cockpit rates - Daily weighted payroll projection
-
- Labor cockpit schedule
- How to make a schedule
- How to revise a schedule
- PMI Schedule: Information and Calculation rows explained
- Predefined shift codes
- How to print a schedule
- Revise staff
- Schedule 1/8 Navigation [5:12]
- Schedule 2/8 How to create a labor cockpit schedule [4:29]
- Schedule 3/8 How to add a team member [2:07]
- Schedule 4/8 How to create a shift code [3:30]
- Schedule 5/8 How to add shift codes to team members [3:41]
- Schedule 6/8 How to create a rotating schedule [3:20]
- Schedule 7/8 How to replace shift codes for a period [2:00]
- Schedule 8/8 How to create split shifts between departments [2:42]
- How to work with the Schedule in PMI
- Split Shifts Between Departments
- The Schedule Tools & View menu options overview
- Show all articles ( 3 ) Collapse Articles
-
-
Live forecast
- Live forecast overview
- How to set up a Live forecast: configuration settings
- Live forecast tools and personal view settings
- PMI prediction explained
- Pickup explanation
- Revenue driver explained
- Segment OTB
- Submit Live Forecast to Forecast (monthly routine)
- NextGen Rooms Live forecast overview
- NextGen Rooms Live forecast: Weekly routine overview
- Rooms live forecast: How to work with auto Live forecast
- NextGen Rooms live forecast: Personal view options
- Rooms Live forecast: Sense check mode explained
- How pickup fields are displayed and used in Room live forecast
- Collaborative Forecasting with PMI Prediction
- Non-rooms Live forecast using PMI prediction
- Live forecast – Copy to live forecast
- Live forecast – Revise forecast/budget
- Rooms Live forecast - Edit guest nights factor explained
- Live forecast settings - Configure food revenue by segment
- Show all articles ( 5 ) Collapse Articles
-
Data analysis views
-
Administration
-
- Add documents to a property
- Currency settings
- Fact sheets overview
- Group external hotel
- How to use hours transfer [3:34]
- Hours transfer rules
- Operational status
- Period locking overview
- Share group
- Share hotel
- How to complete Classification Fact sheet
- How to use Period locking for R&P in practice
- How to manage GoGreen Period locking
-
- How to view imported data in the Import status
- Import status overview
- How to read the Import status page
- Handling Outstanding Imports (Missing Data) in PMI
- Understanding the Import status settings
- Import status - Understanding advanced Data offset validation for GoGreen and Food Purchase interfaces
- Import status - Understanding statuses
- How to reload an API import
-
-
GoGreen
-
- Introduction to GoGreen planning
- Overview of GoGreen Planning
- GoGreen plan values explained
- GoGreen planning charts explained: using charts to understand my forecast
- How to set up GoGreen planning for a chain or property
- How to do a GoGreen monthly forecast routine
- Navigation and filters in NextGen planning page: explanation with examples
- Data table general explained
- Sense check mode in new planning pages explained
- How to edit a GoGreen plan
- GoGreen home page overview
- GoGreen Doing Cockpit overview
- GoGreen Learning page overview
- GoGreen index overview
- Weather normalization overview
- CO2 factors overview
- GoGreen targets explanation
- GoGreen index: How are the measurements calculated?
- Useful links for sustainability and environmental management best practice
- How to make a manual entry in a GoGreen cockpit
- Weather normalization explained
- GoGreen benchmarking enhancement - 01.23
- GoGreen – Data Integration & Insights (Overview)
- Environmental Sustainability in Hotels – Foundation
- Environmental Dimensions in Hotel Operations (Energy, Water, Waste, Emissions, etc.)
- Environmental Management Systems (EMS) in Hotels
- GoGreen Monitoring, Measurement, and Performance Evaluation in Hotels
- Waste Measurement and Verification in Hotels
- Emergency Preparedness and Environmental Risk Management in Hotels
- Hotel Water Consumption Profile & Key KPIs
- Domestic Hot Water Systems in Hotels (Efficiency & Legionella Control)
- Cooling Towers and Water Efficiency in Hotel HVAC Systems
- Water Metering, Submetering and Leak Detection in Hotels
- Preventive Water Management Tasks for Hotels
- Nordic Swan Ecolabel for Hotels
- How the Nordic Swan Criteria and Scoring Work
- BREEAM Certification for Hotels Explained
- Green Key Certification for Hotels
- Hotel Energy Consumption and Key Performance Indicators
- Hotel Energy Benchmarking (A++–G Classification)
- HVAC Systems and Energy Optimization in Hotels
- Boiler Systems and Heating Efficiency in Hotels
- Building Management Systems (BMS) and Energy Monitoring
- Preventive Energy Management and Engineering Tasks
- GoGreen Sustainability Knowledge Hub
- Advanced Water Optimization in Hotels
- Smart Leak Detection in Hotels
- Smartvatten Leak Alarms for Hotels
- How to Investigate Water Leaks in a Hotel
- Water Balance Modeling and Water Analytics for Hotels
- Smart Irrigation and Cooling Tower Water Optimization in Hotels
- Hotel Water Management and Optimization – Overview
- How to Control Linen Inventory in Hotels
- How to Set Up a Food Waste Management Program in Hotels
- How to Run a Food Waste Audit in Hotels
- Food Waste Troubleshooting and Best Practices for Hotels
- PMI Energy Heatmap – Understanding Energy Consumption Patterns
- How to Control Your Hotel Using Data and Operational Discipline
- PMI GoGreen Cockpit – Managing Sustainability Performance in Hotels
- How to Set Up GoGreen in PMI
- How to Measure and Manage Waste in Hotels
- GSTC Hotel Standard – What It Is and How It Applies to Hotels
- Green Key Certification for Hotels – What It Is and How It Works
- Sustainability Certifications for Hotels – GSTC, Green Key, Nordic Swan, and BREEAM
- GoGreen in PMI – Sustainability and Operational Efficiency in Hotels
- PMI GoGreen Knowledge Hub
- Hotel Energy Benchmark – Energy Analysis Reference
- Hotel Energy Optimization – Understanding Base Load, Peaks, and Energy Performance
- Hotel Energy KPIs Explained: Base Load, Peak Demand, and Key Metrics
- How to Analyze Hotel Energy Consumption Patterns
- How to Identify Energy Savings Opportunities in Hotels
- Green Key Certification in Hotels – Overview and Practical Application
- Green Key Criteria – Mandatory and Optional Tasks (Pre-defined)
- Understanding your GoGreen monthly targets
- Show all articles ( 49 ) Collapse Articles
-
-
KPIs
-
PMI adoption index
-
General user knowledge
-
Miscellaneous
-
Access system
- Articles coming soon
-
FAQ
-
- How can I see the hours that are imported to PMI?
- How do I enter the rates?
- How do I know if I am scheduling according to activity?
- How does PMI summarize the hours?
- How is productivity calculated?
- What are fixed hours?
- What are productive and non-productive hours?
- What are the rates and how are they calculated?
- What is a cost driver?
- What is min/max hours?
- Why do the planned hours in the Timekeeping System (TKS) not match PMI?
- Why is the total number of hours for the month too low/high?
- What is SMART?
- How F&B departments can set realistic targets when room revenue drops temporarily
- Why is my MTD SMART productivity different from my ME SMART productivity when my cockpit is locked on Productivity?
-
- How do I estimate my Closing Inventory?
- My food cost % is wrong (too high/low). Why is that?
- My turnover days are set to 32. What does that mean?
- What are my routines in the Food cost cockpit?
- What do I enter in the Purchase column?
- What is opening and closing stock?
- What is the recommended number of turnover days?
- What is turnover days and how is it calculated?
- Where do I change my food cost forecast?
- Why is opening and closing stock important?
-
- Can one employee work in two departments?
- How do I add a shift code?
- How do I copy hours into the unspecified row (Timekeeping system excluded)
- How do I create a rotating schedule?
- How do I make a new schedule?
- How do I navigate the tools in the schedule?
- What are timekeeping system (TKS) excluded hours for?
- How do I add a schedule to my cockpit?
- Do workers added in the schedule get carried over to future months?
-
- Do I have to change my budget & forecast manually every month?
- How can I see what the current cost driver is?
- How do I set a productivity goal?
- How does the cost driver effect my hours and productivity?
- Where can I find the upload function?
- Why are my budget and forecast locked?
- What is Room revenue planning?
-
- How do I copy to Live forecast?
- How do I submit my Live forecast to forecast?
- How do I reset the pickup for a full month?
- Why do I have a red triangle to the left of the date?
- What are Pickup statistics?
- What are covers?
- What are the seasons in PMI?
- What do the pickups show and why are they sometimes negative?
- What is a revenue driver?
- What is the difference between Forecast and Live forecast?
- Why does on the books in PMI not match what we have in our PMS?
- How do I calculate ARR and ADR?
-
- Can I edit the figures in the Flash report?
- Different view options in the Flash report
- How am I performing compared to my forecast/budget/last year?
- How can I print the report?
- How can I switch between viewing daily and monthly figures?
- How do I check what segments add to the total daily figure?
- How do I edit my covers?
- Why are my room/guest nights wrong?
- What is the Flash Report
- Why is my revenue wrong?
- How is the month-to-date forecast and budget calculated in the Flash report?
- Why are the numbers in the Flash report different from the Live forecast?
- Where can I see account mapping details?
-
- How do I know if the mapping is correct?
- How do I know where accounts should go in PMI?
- How do I map the categories in the timekeeping system (TKS)?
- I cannot see my department in Timekeeping System (TKS) mapping. How do I see it?
- There is a position missing in the Timekeeping system mapping. How can I fix this?
- What are Categories in PMI Timekeeping system?
- What is Departments in Timekeeping system (TKS) mapping?
- What is mapping accounts?
- What is mapping – timekeeping system?
- Why don’t I see the spoon and fork icon in account mapping?
-
PMI Release notes
-
- GoGreen Task Bank and Cockpit enhancements - 12.24
- Refrigerants and Fuel Tracking for GoGreen cockpits enhancement - 11.24
- KPI targets enhancement - 10.24
- Automatic renewal of constants enhancement - 10.24
- GoGreen manual entry enhancement - 10.24
- CO2 factors enhancement - 09.24
- KPI targets enhancement - 07.24
- NextGen Rooms Live forecast statistics and pickup data enhancement - 07.24
- Date picker enhancement - 07.24
- Update to NextGen Rooms Live forecast - 06.24
- P&L planning accounts enhancement - 06.24
- Weather normalization enhancement - 05.24
- Update to NextGen Rooms Live forecast page: Sense check updates - 05.24
- PMI adoption index enhancement - 05.24
- PMI adoption index enhancements - April 2024
- Consolidation OTB enhancement - April 2024
- Update to NextGen Rooms live forecast page: Personal view options, Mar 2024
- User administration enhancements March 2024
- GM daily digest enhancement March 2024
- PMI Index calculation updates for 2024
- KPI targets enhancement February 2024
- KPI targets enhancement - January 2024
- Show all articles ( 7 ) Collapse Articles
-
- GoGreen benchmarking enhancement - 01.23
- GoGreen index calculation enhancement - 04.23
- PMI adoption index: Help videos for measurements enhancement - 02.23
- Activity log enhancement - 07.23
- Arrivals and departures forecast enhancement - 02.23
- KPI upload tool enhancement - 08.23
- GoGreen Food waste cockpit enhancement - 08.23
- GoGreen Doing cockpit enhancement - 06.23
- Benchmarking: PMI Index value updates based on time period selected - 06.23
- GoGreen cockpit: Highlight months missing data on 12 month graph - 07.23
- KPI targets enhancement - 01.23
- Goal distribution tool enhancement - 09.23
- Live forecast enhancement: Editing ARR values -12.23
- User administration release note - 12.23
- New page view of Rooms live forecast - 12.23
-
- Benchmarking calculation enhancement - 03.22
- Enhancement to add department type in the P&L report - 03.22
- Print all unmapped accounts on chain level - 03.22
- Printing to Excel and PDF enhancement - 03.22
- Introduction to PMI enhancement
- Room Live forecast – Change to pickup fields - 04.22
- Information/calculation rows in PMI schedule - 09.22
- Export to Google Sheets enhancement - 08.22
- PMI Advanced settings – Period locking - 06.22
- GM daily digest enhancements - 09.22
- PMI adoption index: Option to filter and export scores enhancement - 12.22
- Profit center Live forecast: Automatically switch between OTB and revenue driver
- SMART Forecast enhancement - 09.22
-
d2o team only
-
- Articles coming soon
-
- Articles coming soon
-
- Articles coming soon
-
- Articles coming soon
-