
How to build a P&L planning report
Summary
The P&L Report Builder allows you to create, manage, and customize Profit & Loss reports for your organization.
Reports are built using sections, values, and blank rows. Values retrieve information from a variety of data sources, such as financial accounts, operational statistics, staff information, and built-in system constants. More advanced reports can combine multiple data sources using formulas.
This article explains how to create, manage, and maintain P&L reports, from understanding the report structure to building advanced calculations.
Intended users
This article is intended for users responsible for creating or maintaining P&L reports, including GM, Controller and Heads of Departments.
Before you begin
Before creating or editing P&L reports, ensure that:
- Your account structure has been configured.
- Account categories and account sums have been created, if required.
- The required operational modules (such as Staff or Cockpit) have been configured if their data will be used in reports.
- You have permission to create or edit P&L reports.
Some data sources are only available if the related PMI module has been enabled and configured.
Navigate to the report builder
Go to Profit & loss, and select the Report from the top menu.
You can edit or create reports under Tools > Reports
The Reports window displays all reports available to the selected property. From here you can:
- Create a new report
- Edit an existing report
- Copy an existing report
- Delete a report
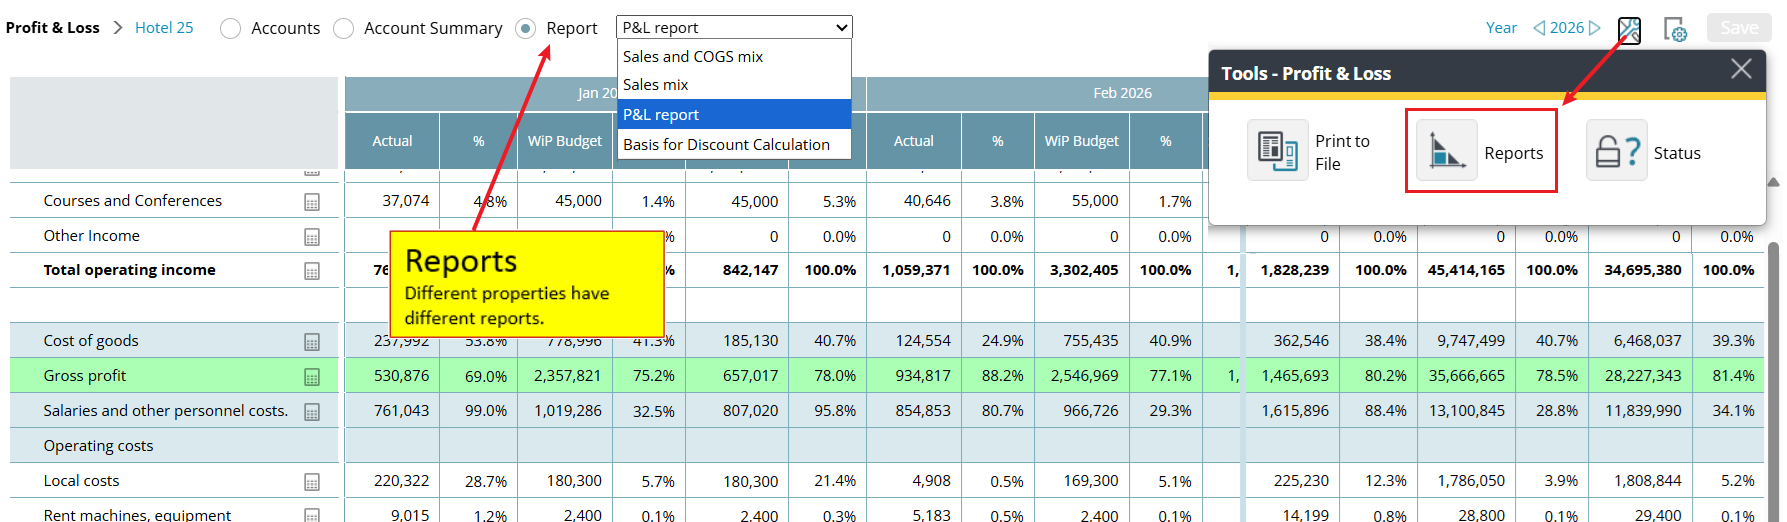
Navigation to the Reports builder/editor
Understanding the Reports page
The Reports page displays all available reports for the selected chain or property.
From this page, you can:
- Lock or unlock a report for editing.
- Copy an existing report.
- Edit an existing report.
- Delete an existing report.
- Sort reports (move up/down the list)
- Create a new report.
- Edit Section name
- Edit & delete formula/calculation
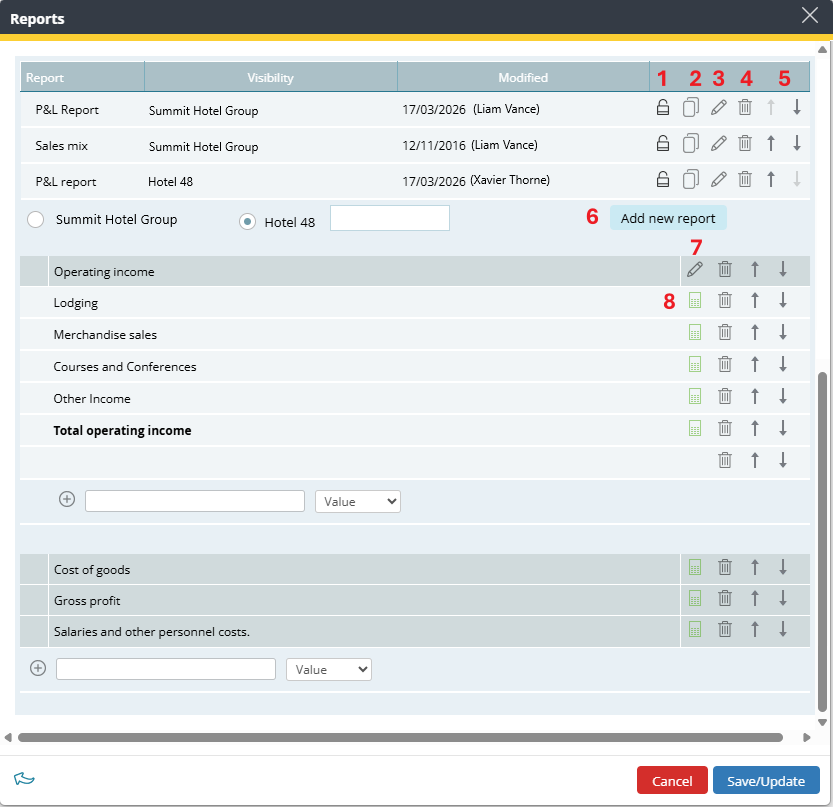
P&L reports builder page
1. Lock or unlock a report
Reports can be locked to protect them from unauthorized changes.
This is particularly useful for chain-level reports, where a single report may be shared across multiple properties. Locking a report helps ensure that report structures and calculations remain consistent across the organization.
A locked report can still be selected and used throughout PMI. However, in the P&L Report Builder, users who do not have permission to unlock the report cannot:
- Open the report in the Report Builder.
- Edit the report.
- Delete the report.
Only HQ Administrators can unlock any locked report, regardless of who created it.
Note: Users with the Controller, Administrator, HQ Controller, and HQ Administrator roles can access the P&L Report Builder. For more information about role permissions, see Report Builder permissions below.
2. Copy an existing report
Select the Copy icon to create a duplicate of an existing report.
When copying a report, you can save it at either Chain or Property level, depending on your user role.
Copying a report preserves its structure and calculations, making it easy to create similar reports without rebuilding them from scratch.
Tip: Copying an existing report is often quicker than creating a new report when only minor changes are required.
3. Edit an existing report
Select the Edit icon next to a report to modify its name or report settings.
To edit individual sections or values within the report, use the edit icons displayed next to each report item.
If the report is locked and you do not have permission to unlock it, the report cannot be opened for editing.
4. Delete an existing report
Select the Delete icon to permanently remove a report. Only reports that are not locked can be deleted.
Note: Deleting a report cannot be undone.
5. Sorting
Use the Move Up and Move Down arrows to change the order in which reports appear in the report list.
Changing the sort order makes it easier for users to find frequently used reports.
6. Create a new report
To create a new report:
- Select whether you want to create the report at Chain or Property level.
- Enter a descriptive Report name.
- Select Add new report.
The new report is added to the report list and opens in the Report Builder, ready to be configured.
Tip: Create reports at Chain level when they will be shared across multiple properties. Create reports at Property level when they are only required for a single property.
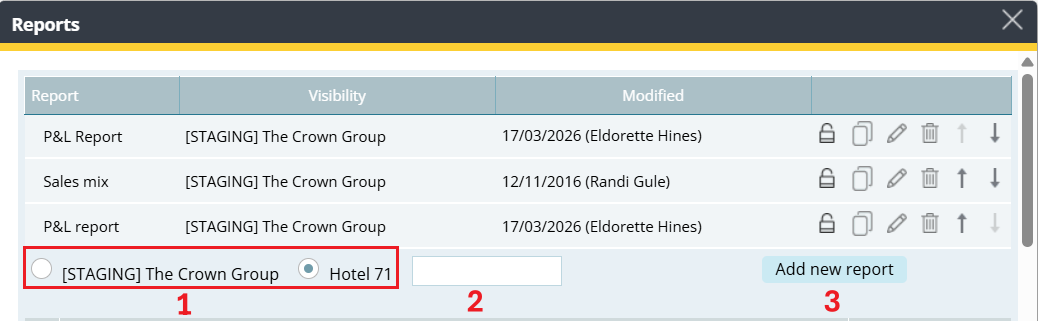
Creating a new report
Report Builder permissions
Access to the P&L Report Builder depends on the user’s assigned role.
|
Action |
Controller / Administrator |
HQ Controller |
HQ Administrator |
| Access the Report Builder | ✓ | ✓ | ✓ |
| Create property-level reports | ✓ | ✓ | ✓ |
| Create chain-level reports | — | ✓ | ✓ |
| Copy reports to property level | ✓ | ✓ | ✓ |
| Copy reports to chain level | — | ✓ | ✓ |
| Edit unlocked reports | ✓ | ✓ | ✓ |
| Delete unlocked reports | ✓ | ✓ | ✓ |
| Lock any unlocked report | ✓ | ✓ | ✓ |
| Unlock reports you created | ✓ | ✓ | ✓ |
| Unlock reports created by another user | — | — | ✓ |
| Rearrange report order | ✓ | ✓ | ✓ |
Note: The permissions in this table apply only to the P&L Report Builder. All users with access to Profit & Loss can select and use available reports, regardless of whether they have access to the Report Builder.
Understand the building blocks of a report
Every P&L report is built using three building blocks:
- Sections organize related information.
- Values display financial or operational data.
- Blank rows improve the layout by adding spacing between report items.
These building blocks can be combined to create reports that are simple or highly detailed, depending on your reporting requirements.
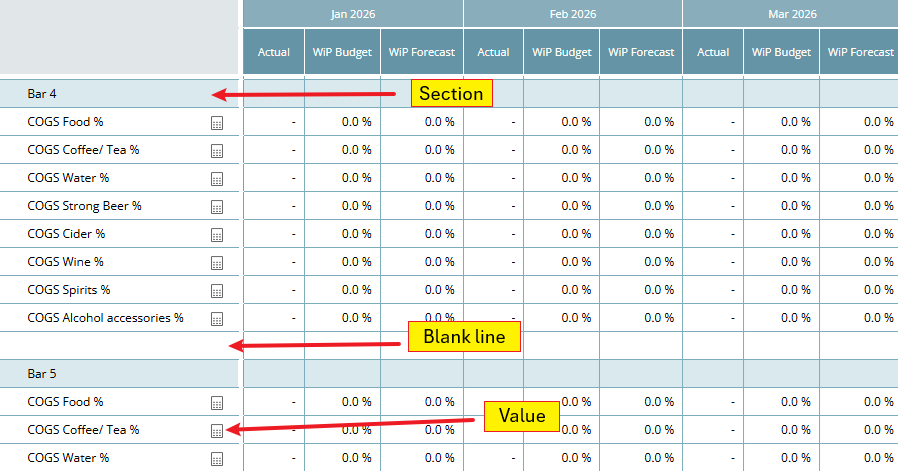
Example report showing sections, values and blank line.
Add items to the report
Once you have created or opened a report, you can begin building its structure.
New items can be added either:
- At the bottom of the report.
- Directly below an existing section.
To add an item:
- Navigate to where you want to insert it.
- Enter a name.
- Select the item type:
- Section
- Value
- Blank row
- Select Add (+).
After an item has been created, it can be edited, moved, or deleted as required.
Bottom of the report showing the add controls
Working with sections
Sections organize related values into logical groups, making reports easier to read and maintain.
For example, you might create sections such as: Revenue, Payroll, Operating Expenses, Key Performance Indicators
Sections act as headings within the report. Although PMI maintains an internal section total for calculations, section totals are not displayed in the report.
Available actions
For each section, you can:
- Edit the section name.
- Move the section up or down.
- Delete the section.
Tip: Create your report structure by adding sections first, then populate each section with values. This makes it easier to organize larger reports.
Working with values
Values display the financial or operational information within a report.
Each value retrieves data from a single data source or from an advanced formula that combines multiple data sources.
Examples of values include:
- Room Revenue
- Food Revenue
- Payroll Cost
- Guest Nights
- Revenue per Available Room (RevPAR)
Values can be placed inside a section or added directly to the report without a section.
Available actions
For each value, you can:
- Edit the value.
- Move the value up or down.
- Delete the value.
- Open the Value settings by selecting the Calculator
The Value settings determine how the value is displayed and how it is calculated.
Working with blank rows
Blank rows are used to improve the layout of a report by creating space between sections or groups of values.
Although a text field is displayed when adding a blank row, any text entered is discarded when the row is created. The result is always a blank line.
Blank rows do not display data and are not included in calculations.
Tip: Use blank rows sparingly to improve readability without creating unnecessary white space.
Value settings
Each value has its own settings that control how it is displayed and calculated.
To open the value settings, select the Calculator icon next to the value.
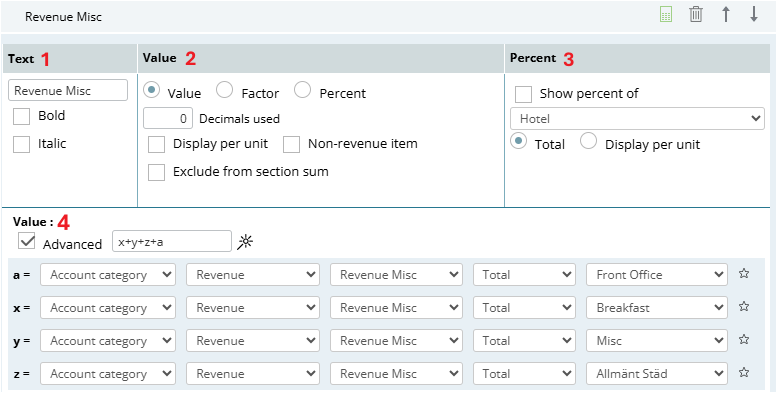
The Value Details window is divided into four sections:
- Text – Controls the value name and formatting.
- Value – Controls how the calculated value is displayed.
- Percent – Controls whether a percentage is displayed and what it is calculated against.
- Value calculation – Defines where the value retrieves its information and how it is calculated.
Bottom of the report showing the add controls
Note: The lower Value section is where you configure the data source or formula used to calculate the value.
1. Text
The Text section controls how the value name is displayed in the report.
Options include Value name, Bold, Italic
Use formatting to highlight totals or draw attention to important values.
2. Value
The Value section controls how the calculated value is displayed.
Depending on the value type, you can configure options such as:
- Display as a value, factor, or percentage
- Number of decimals
- Display per unit
- Non-revenue item
- Exclude from section sum (see note below)
These settings affect how the value is presented in the report and how it is used in certain calculations.
Note: Exclude from section sum:
When ‘Show percent of’ is enabled and the percentage is based on a section total, PMI calculates an internal section sum to use as the comparison value.
Selecting ‘Exclude from section sum’ removes the value from this internal calculation.
Although the section sum is not displayed in the report, it affects the percentages calculated for other values within the same section.
3. Percent
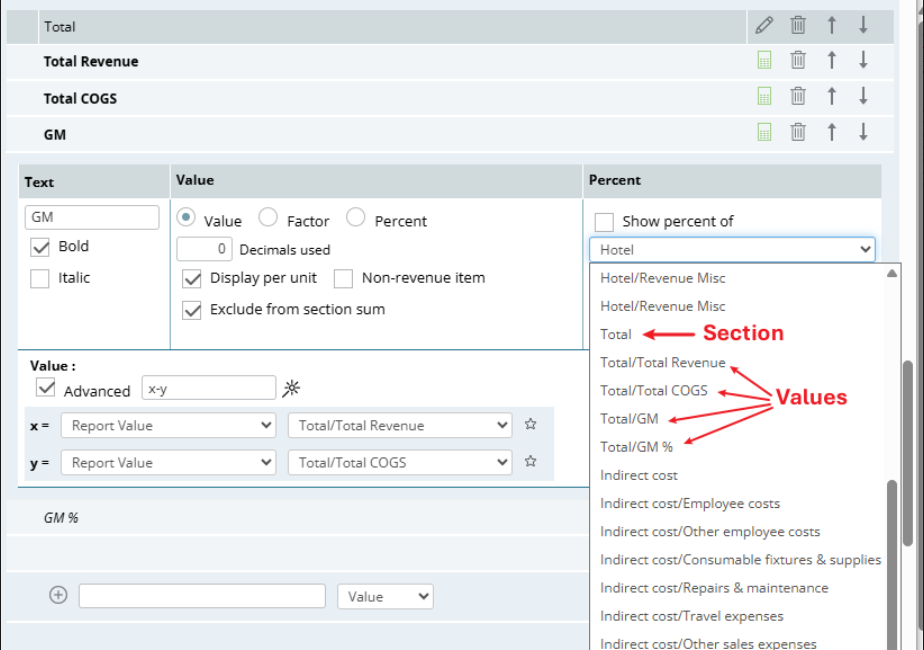
The Percent section determines what the value should be displayed as a percentage of when Show percentage is enabled in the report View settings.
Select Show percent of, then choose a section or value from the same report to use as the comparison.
When Show percentage is enabled, PMI calculates what percentage the current value represents of the selected section or value.
Examples
- Room Revenue displayed as a percentage of Total Revenue.
- Payroll Cost displayed as a percentage of Total Expenses.
- Gross Margin displayed as a percentage of Total Revenue.
Note: Percentages are only displayed when Show percentage is enabled in the report View settings.
Percentage of selected report item
4. Value calculation
The Value calculation section defines where the value retrieves its information.
By default, the Advanced checkbox is cleared, allowing the value to retrieve information from a single data source. Select the required source from the Source drop-down list.
To create a formula using multiple data sources, select Advanced.
The available data sources and advanced formulas are explained in the following sections.
How values work
Every value in a P&L report displays the result of a calculation.
The calculation can be as simple as retrieving data from a single data source, or as advanced as combining multiple data sources using a formula.
For example, a value can display:
- Revenue from a single account category.
- Guest Nights from hotel statistics.
- Labor Cost from the Staff module.
- Gross Margin (GM) calculated by subtracting Cost of Goods Sold (COGS) from Total Revenue.
Understanding how values retrieve information makes it easier to build both simple and advanced reports.
Value calculation
The Value calculation section determines how a value retrieves its data.
By default, the Advanced checkbox is selected off, allowing the value to retrieve information from a single data source.
If you need to combine multiple data sources, select Advanced to build a formula.
Single data source
When Advanced is not selected, the value retrieves information from a single data source.
Choose the required Data source, then configure the available options for that source.
The available options depend on the selected data source.
Examples include:
- Account Category
- Account Sum
- Hotel
- Staff
- Constant
Available data sources and how it works
A data source determines where a value retrieves its information.
Select the appropriate data source based on the type of information you want to display in the report. The available configuration options vary depending on the selected data source.
The following sections describe each data source available in the Value calculation dropdown.
Then continue with the list in the same order as the dropdown.
Account category
Use Account category to retrieve values from your P&L account module.
Select the required:
- Category
- Subcategory
- Division
- Department group
For example:

This data source is useful when reports need to summarize values based on the financial hierarchy rather than individual accounts.
Account sum
Use Account sum to retrieve values from Account Sums that have already been configured.
Account Sums are maintained in Profit & Loss > Tools > Accounts and can be reused across multiple reports.
If no Account Sums have been configured, no options are available for selection.

Account Sum setup in Tools > Account
Account ID (Division)
Use Account ID (Division) when you want to retrieve values for a specific account in the P&L Account module.
Select the required:
- Category
- Subcategory
- Account number
- Division
This option is useful when you need to report on a specific account grouped per Division.

Account ID (Department Type)
This option works in the same way as Account ID (Division).
Instead of selecting a Division, the final selection is the Department Type.
Department Types are configured in the Chain Hierarchy.

Hotel
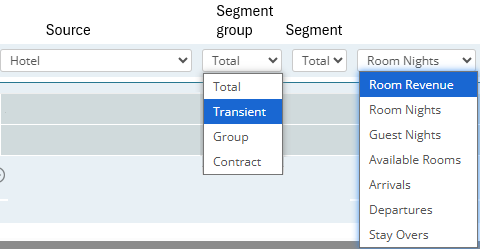
Use Hotel to retrieve operational values from the Rooms department in R&P.
Select the required:
- Segment Group
- Segment
- Statistic
Available statistics include:
- Room Revenue
- Room Nights
- Guest Nights
- Available Rooms
- Arrivals
- Departures
- Stay Overs
This data source is commonly used when combining operational statistics with financial information.
PMI R&P – Labor
Use PMI R&P – Labor to retrieve labor-related values from the Cockpit module.
Depending on your configuration, you can select:
- Division
- Cockpit
- Hour, Rate or Labor Cost
PMI R&P – Profit Center
Use PMI R&P – Profit Center to retrieve budget/forecast values from Budget and Forecast or Live forecast modules.
Select the required:
- Division
- Department
- Revenue or Covers (depending on the department)
- Segment
This data source automatically reflects the current budget or borecast values from Budget & Forecast or Live forecast modules.
Report value
Use Report value to retrieve the result of another Value calculation that already exists in the report.
For example, you can reference:
- Another value.
- A section total (where applicable in calculations).
This option is commonly used when building formulas and helps avoid duplicating calculations.
Constant
The Constant data source provides built-in calendar values that can be used in report calculations.
Currently, two constants are available:
- Days in Month
- Work Days in Month
These values make it easier to calculate daily averages and similar metrics without creating helper accounts.
Example: To calculate Average Daily Revenue, divide Total Revenue by Days in Month.
Note: Work Days in Month represents the number of weekdays (Monday to Friday) in the selected month. Public holidays are not taken into account.
Staff
Use Staff to retrieve information from the P&L Staff module.
Examples include:
- Hours
- Rates
- Salary
The available options depend on your Staff configuration.
Note: This data source is only available if the P&L Staff module has been enabled and configured.
Advanced formulas
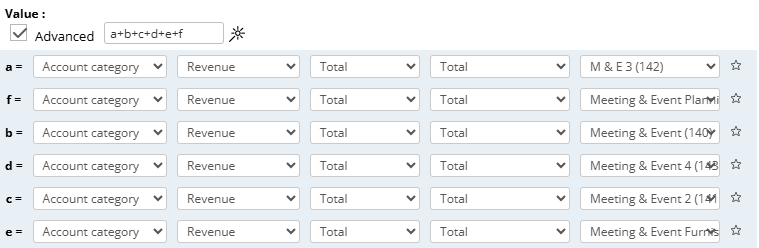
Advanced formulas allow you to combine multiple data sources to create custom calculations.
Unlike a standard value, which retrieves information from a single data source, an advanced formula can perform calculations using several values.
To create an advanced formula:
- Select Advanced in the Value calculation
- Enter the required formula.
- Select the Magic Wand icon to generate the variables used in the formula.
- Configure the data source for each variable.
For example:
X * Y + (C + D)
Initially, the formula editor contains a single variable (X).
You can rename variables if required.
Select the Magic Wand button to automatically create a row for each variable used in the formula.
Complete each variable by selecting the appropriate data source. Each variable can use any of the data sources described earlier in this article.
Once all variables have been configured, select Update to save the calculation. The calculated value is immediately available in the report.
Tip: Create the formula before selecting the Magic Wand. This ensures that all variables are generated automatically.
Advanced Formula editor
Tips
- Build the report structure before creating calculations.
- Use descriptive names for sections and values.
- Reuse Report Values instead of repeating the same calculation.
- Use Account Sums for commonly used account combinations.
- Keep chain-level reports locked when they are shared across multiple properties.
- Use Copy to create similar reports instead of building them from scratch.
FAQ’s
Q: I cannot edit a report.
A: The report may be locked. If you did not create the report, contact your HQ Administrator to unlock it.
Q: I cannot find the required data source.
A: Some data sources are only available when the related PMI module has been enabled and configured. E.g. P&L Staff
Q: My percentage is not displayed.
A: Verify that:
- Show percent of has been configured for the value.
- Show percentage has been been enabled in the report View settings.
Q: My report does not display the expected value.
A: Verify that:
- The correct data source has been selected.
- The correct account, section, or value has been selected.
- Advanced formulas reference the correct variables.