How to modify a P&L report
What is its purpose?
There are several more choices that increase flexibility in the P&L Report module. It’s easier to focus on what figures you are looking at, and the menus are more informative.
What are the actual modifications?
1. Actual: Actual/ Live Forecast and Actual & Forecast WiP listed first. Sub-menu for Approved with Actual & Forecast Approved and Actual & Forecast PY year Approved.
2. Forecast: Forecast WiP listed first. Sub-menu for Approved and Other submitted. Approved will only list the last approved version. Other submitted should show the last three submitted.
3. Target: Same as Forecast above
4. Version name (FCT5 2019 as an example) should be listed behind submit date on all submitted entries, where it exists (note that all WiP will not have a version name).
5. If a report runs for a group, identification should be VersionName from table Planning_Submited_Version, if version exists. Find the same version for the group hotels. If the version does not exist, select as today.
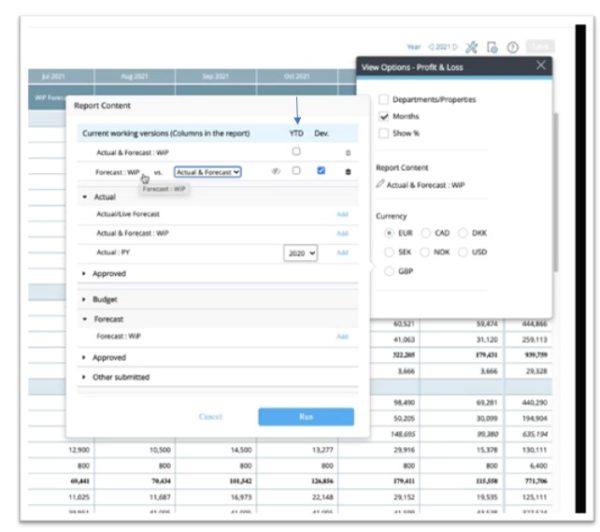
6. When an entry is selected and added under the Current working version, a tick box for YTD is available. If ticked should accumulate all months, as with YTD today. If not ticked, show monthly values as today.
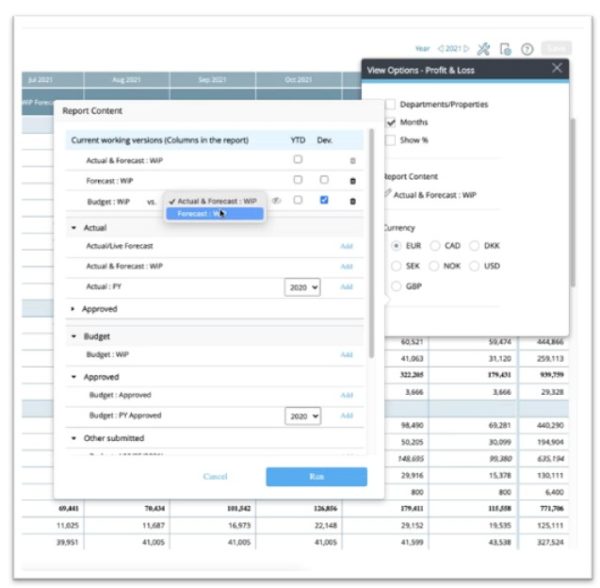
7. A tick box for deviation is also made available, but ONLY for rows 2 and below.
– If Dev is ticked, a drop-down list with all entries ABOVE this entry is listed, but NOT any entry with Dev already ticked. Choose the column you want to compare with.
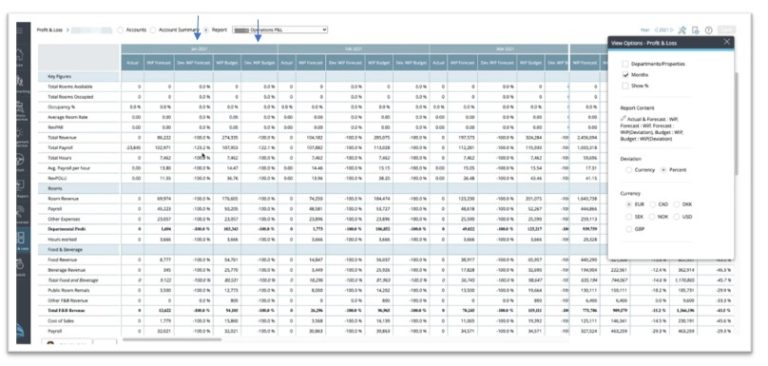
8. When running the report, the Dev. option will produce two columns, the data column (e.g. Forecast WiP) and the column showing the deviation between this and the chosen column. If a is Actual and b is Forecast WiP, where Actual is listed as the first column, the Dev should be calculated as a-b.
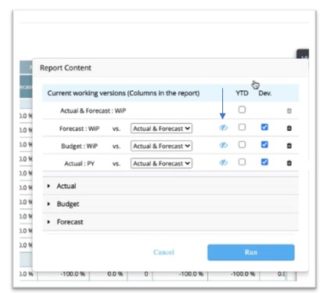
– If Dev is ticked a “hide” icon will be visible. Mark this, and the data column (Forecast WiP with the example above) should be hidden.
Report:
- Headers should show version number if version exists, Approved, Last Submitted, Prev. Submitted. The date should only show in the tool tip.
- Always use Submit date when showing data, not Status date.
Account module, View Options, Versions:
- Show in brackets (Status, Submit Date, Version, Submit user), previously it was (Status, Status date, Status user).
- Show Reference, reference options should also have the above information in brackets.
-
Getting started
-
-
- Arrivals/Departures
- Data elements required from PMS
- Manual Export PMS – Fidelio
- How to do a manual PMS export from Opera
- Manual Export PMS – Picasso
- Manual Export PMS – Protel
- Manual Export PMS – Spirit Web
- PMS – Cenium
- PMS – Citybreak
- PMS – Fidelio
- PMS – Opera
- PMS – Protel
- How to do a manual PMS export from HotSoft
- PMS – Skidata
- How to set up an Opera reports export
- PMI API
- PMI API Best Practice Get Forecasted hours
- PMI File Agent setup and documentation
- Technical specification for data integration
- How to transfer data to PMI
- How to enable Opera Cloud reports
- PMI system integration overview
- Import status overview
- Handling Outstanding Imports (Missing Data) in PMI
- How to read the import status page
- Opera Scheduler setup - Reservation Statistics 1
- Opera Scheduler setup - Report Trial Balance (trial_balance)
- Opera Scheduler setup - Reservation Forecast, (res_forecast)
- Opera Scheduler setup - Reservation History & Forecast (history_forecast)
- Opera Scheduler setup - Daily Forecast Report
- Opera Scheduler setup - SFTP transfer guide
- Manual Export PMS Opera
- Report 1 (manual export): Reservation Statistics 1 (res_statistics1)
- Report 2 (manual export): Reservation Forecast, (res_forecast)
- Report 3 (manual export): Trial Balance (trial_balance)
- Report 4 (manual export): Reservation History & Forecast (history_forecast)
- Show all articles ( 7 ) Collapse Articles
-
Video tutorials
-
- Administration Labor cockpit [14:49]
- Bar and Pub Labor cockpit [12:21]
- Breakfast Labor cockpit [12:05]
- Consolidated view in Benchmarking and Management Perspective [3:20]
- Flash Report Onboarding [6:27]
- Flash report overview [2:25]
- Food cost cockpit [6:21]
- Kitchen Labor cockpit [11:28]
- Labor Cockpit Onboarding [18:16]
- Labor cockpit overview [3:12]
- Live forecast 1/5 navigation [5:05]
- Live Forecast 2/5 Rooms [5:05]
- Live forecast 3/5 meeting & event [5:40]
- Live forecast 4/5 food & beverage [6:11]
- Live forecast 5/5 breakfast [7:19]
- Live forecast onboarding [6:06]
- Live forecast overview [2:58]
- Management perspective overview [3:06]
- P&L Planning 1/10 Purpose and benefits [2:25]
- P&L Planning 10/10 How to approve forecast and budget or target [2:34]
- P&L Planning 2/10 Navigation [4:26]
- P&L Planning 3/10 How to build a total [4:29]
- P&L Planning 4/10 Three ways of inserting figures [4:32]
- P&L Planning 5/10 How to add a sub account [1:42]
- P&L Planning 6/10 How to build a constant [2:42]
- P&L Planning 7/10 Staff module [2:48]
- P&L Planning 8/10 How to add a staff member [1:33]
- P&L Planning 9/10 How to revise and submit a forecast [3:01]
- Repair and Maintenance Labor cockpit [13:01]
- Restaurant Labor cockpit [12:30]
- Schedule 1/8 Navigation [5:12]
- Schedule 2/8 How to create a labor cockpit schedule [4:29]
- Schedule 3/8 How to add a team member [2:07]
- Schedule 4/8 How to create a shift code [3:30]
- Schedule 5/8 How to add shift codes to team members [3:41]
- Schedule 6/8 How to create a rotating schedule [3:20]
- Schedule 7/8 How to replace shift codes for a period [2:00]
- Schedule 8/8 How to create split shifts between departments [2:42]
- Stewarding Labor cockpit [11:38]
- Timesheet Onboarding [4:14]
- Show all articles ( 25 ) Collapse Articles
-
- Articles coming soon
-
- Administration Labor cockpit [14:49]
- Bar and Pub Labor cockpit [12:21]
- Breakfast Labor cockpit [12:05]
- Food cost cockpit [6:21]
- Front office Labor cockpit [12:05]
- Housekeeping Labor cockpit [11:20]
- Kitchen Labor cockpit [11:28]
- Labor Cockpit Onboarding [18:16]
- Labor cockpit overview [3:12]
- Repair and Maintenance Labor cockpit [13:01]
- Restaurant Labor cockpit [12:30]
- Schedule 1/8 Navigation [5:12]
- Schedule 2/8 How to create a labor cockpit schedule [4:29]
- Schedule 3/8 How to add a team member [2:07]
- Schedule 4/8 How to create a shift code [3:30]
- Schedule 5/8 How to add shift codes to team members [3:41]
- Schedule 6/8 How to create a rotating schedule [3:20]
- Schedule 7/8 How to replace shift codes for a period [2:00]
- Schedule 8/8 How to create split shifts between departments [2:42]
- Stewarding Labor cockpit [11:38]
- Timesheet Onboarding [4:14]
- Show all articles ( 6 ) Collapse Articles
-
- How to create a pre-populated new plan for Budget or Forecast [3:02]
- How to edit a plan [3:52]
- P&L Planning 1/10 Purpose and benefits [2:25]
- P&L Planning 10/10 How to approve forecast and budget or target [2:34]
- P&L Planning 2/10 Navigation [4:26]
- P&L Planning 3/10 How to build a total [4:29]
- P&L Planning 4/10 Three ways of inserting figures [4:32]
- P&L Planning 5/10 How to add a sub account [1:42]
- P&L Planning 6/10 How to build a constant [2:42]
- P&L Planning 7/10 Staff module [2:48]
- P&L Planning 8/10 How to add a staff member [1:33]
- P&L Planning 9/10 How to revise and submit a forecast [3:01]
-
- PMI GoGreen - Cockpit overview [2:49]
- How to create a pre-populated new plan for Budget or Forecast [3:02]
- PMI GoGreen - Water [3:04]
- PMI GoGreen - Missed opportunities [2:57]
- PMI GoGreen - Register actual consumption [2:24]
- PMI GoGreen -Towels & linens [3:02]
- PMI GoGreen - How to prevent food waste [3:03]
- PMI GoGreen - How to reduce energy waste [3:08]
- PMI GoGreen - Waste [3:04]
-
- Articles coming soon
-
-
PMI Release notes
-
- GoGreen Task Bank and Cockpit enhancements - 12.24
- Refrigerants and Fuel Tracking for GoGreen cockpits enhancement - 11.24
- KPI targets enhancement - 10.24
- Automatic renewal of constants enhancement - 10.24
- GoGreen manual entry enhancement - 10.24
- CO2 factors enhancement - 09.24
- KPI targets enhancement - 07.24
- NextGen Rooms Live forecast statistics and pickup data enhancement - 07.24
- Date picker enhancement - 07.24
- Update to NextGen Rooms Live forecast - 06.24
- P&L planning accounts enhancement - 06.24
- Weather normalization enhancement - 05.24
- Update to NextGen Rooms Live forecast page: Sense check updates - 05.24
- PMI adoption index enhancement - 05.24
- PMI adoption index enhancements - April 2024
- Consolidation OTB enhancement - April 2024
- Update to NextGen Rooms live forecast page: Personal view options, Mar 2024
- User administration enhancements March 2024
- GM daily digest enhancement March 2024
- PMI Index calculation updates for 2024
- KPI targets enhancement February 2024
- KPI targets enhancement - January 2024
- Show all articles ( 7 ) Collapse Articles
-
- GoGreen benchmarking enhancement - 01.23
- GoGreen index calculation enhancement - 04.23
- PMI adoption index: Help videos for measurements enhancement - 02.23
- Activity log enhancement - 07.23
- Arrivals and departures forecast enhancement - 02.23
- KPI upload tool enhancement - 08.23
- GoGreen Food waste cockpit enhancement - 08.23
- GoGreen Doing cockpit enhancement - 06.23
- Benchmarking: PMI Index value updates based on time period selected - 06.23
- GoGreen cockpit: Highlight months missing data on 12 month graph - 07.23
- KPI targets enhancement - 01.23
- Goal distribution tool enhancement - 09.23
- Live forecast enhancement: Editing ARR values -12.23
- User administration release note - 12.23
- New page view of Rooms live forecast - 12.23
-
- Benchmarking calculation enhancement - 03.22
- Enhancement to add department type in the P&L report - 03.22
- Print all unmapped accounts on chain level - 03.22
- Printing to Excel and PDF enhancement - 03.22
- Introduction to PMI enhancement
- Room Live forecast – Change to pickup fields - 04.22
- Information/calculation rows in PMI schedule - 09.22
- Export to Google Sheets enhancement - 08.22
- PMI Advanced settings – Period locking - 06.22
- GM daily digest enhancements - 09.22
- PMI adoption index: Option to filter and export scores enhancement - 12.22
- Profit center Live forecast: Automatically switch between OTB and revenue driver
- SMART Forecast enhancement - 09.22
-
Onboarding
-
- Onboarding roles overview
- Onboarding roles – Breakfast
- Onboarding roles – Finance
- Onboarding roles – Food cost
- Onboarding roles – Front Office
- Onboarding roles – Housekeeping
- Onboarding roles – Kitchen
- Onboarding roles – Restaurant and Meeting & Event
- Onboarding roles – Stewarding
- Onboarding roles – Repair and Maintenance
- GM Introduction to PMI
- Onboarding roles – Bar and Pub
- Onboarding roles – Administration
-
-
GM's corner
-
PMI homepage
-
PMI planning
-
- How to work with Rooms Budget and forecast
- How to work with non-rooms Budget and forecast
- Use Forecast/Budget hours from Cockpit in P&L Staff module
- How to input a budget in PMI
- Setting productivity targets in PMI
- Express planner overview
- How to run Express planner
- How to configure Express planner settings
- Express planner calculation explanation with examples
- Compiling revenue streams overview
- How to manually enter a revenue budget in PMI
- How to enter a revenue budget in PMI using Live forecast data
- How to enter a revenue budget in PMI using the Data Upload Centre
- How to set monthly labor productivity and hour targets in PMI
-
- Accounts overview
- How to populate and edit accounts
- How to approve a forecast or budget in PMI
- How to copy from reference
- How to edit and update using the staffing tool
- How to make a profit forecast
- How to set up a weekly Live forecast
- How to add a comparison year in P&L
- How to modify a P&L report
- Planning Menu – Tools and View Options overview
- Planning staff module overview
- How to build a P&L planning report
- How to add staff and manage staff cost
- Staffing screen overview
- How to input a budget in PMI
- PMI Planning module overview
- How to add a Food & beverage revenue forecast in P&L Planning
- How to add room revenue in Planning
- Show all articles ( 3 ) Collapse Articles
-
-
Cockpit
-
- Labor cockpit overview
- Labor Cockpit Preparations
- Labor cockpit cost driver
- SMART forecast explained
- How does SMART allocate daily hours?
- Using arrivals and departures as a cost driver
- Closing Profit Center or Cockpit
- How to work with labor cost
- Min/Max explanation
- Parent and sub-cockpits explained
- Staffing guide explained
- Daily and weekly routines for department heads
- Understanding the importance of including outsourced labor hours in PMI
- How to add labor cost in PMI
-
- Labor cockpit schedule
- How to make a schedule
- How to revise a schedule
- PMI Schedule: Information and Calculation rows explained
- Predefined shift codes
- How to print a schedule
- Revise staff
- Schedule 1/8 Navigation [5:12]
- Schedule 2/8 How to create a labor cockpit schedule [4:29]
- Schedule 3/8 How to add a team member [2:07]
- Schedule 4/8 How to create a shift code [3:30]
- Schedule 5/8 How to add shift codes to team members [3:41]
- Schedule 6/8 How to create a rotating schedule [3:20]
- Schedule 7/8 How to replace shift codes for a period [2:00]
- Schedule 8/8 How to create split shifts between departments [2:42]
- How to work with the Schedule in PMI
- Split Shifts Between Departments
- The Schedule Tools & View menu options overview
- Show all articles ( 3 ) Collapse Articles
-
-
Live forecast
- Live forecast overview
- How to set up a Live forecast: configuration settings
- Live forecast tools and personal view settings
- PMI prediction explained
- Pickup explanation
- Revenue driver explained
- Segment OTB
- Submit Live Forecast to Forecast (monthly routine)
- NextGen Rooms Live forecast overview
- NextGen Rooms Live forecast: Weekly routine overview
- Rooms live forecast: How to work with auto Live forecast
- NextGen Rooms live forecast: Personal view options
- Rooms Live forecast: Sense check mode explained
- How pickup fields are displayed and used in Room live forecast
- Collaborative Forecasting with PMI Prediction
- Non-rooms Live forecast using PMI prediction
- Show all articles ( 1 ) Collapse Articles
-
Data analysis views
-
Administration
-
GoGreen
-
- Comparative data explained
- Data table general explained
- Formula/Calculations explained
- Goal charts and YoY comparison explained
- How to edit a GoGreen plan
- How to set up a Plan
- Intro to NextGen GoGreen Planning
- Main chart explained
- Plan values explained
- Save changes button explained
- Sense check mode explained
- Unit price explained
- Volume/usage/consumption explained
- How to do a monthly forecast routine in NextGen Planning
- GoGreen home page overview
- GoGreen Doing Cockpit overview
- GoGreen Learning page overview
- GoGreen index overview
- Weather normalization overview
- CO2 factors overview
- GoGreen targets explanation
- GoGreen index: How are the measurements calculated?
- Useful links for sustainability and environmental management best practice
- How to make a manual entry in a GoGreen cockpit
- Weather normalization explained
- GoGreen benchmarking enhancement - 01.23
- GoGreen – Data Integration & Insights (Overview)
-
-
FAQ
-
- How can I see the hours that are imported to PMI?
- How do I enter the rates?
- How do I know if I am scheduling according to activity?
- How does PMI summarize the hours?
- How is productivity calculated?
- What are fixed hours?
- What are productive and non-productive hours?
- What are the rates and how are they calculated?
- What is a cost driver?
- What is min/max hours?
- Why do the planned hours in the Timekeeping System (TKS) not match PMI?
- Why is the total number of hours for the month too low/high?
- What is SMART?
- How F&B departments can set realistic targets when room revenue drops temporarily
-
- How do I estimate my Closing Inventory?
- My food cost % is wrong (too high/low). Why is that?
- My turnover days are set to 32. What does that mean?
- What are my routines in the Food cost cockpit?
- What do I enter in the Purchase column?
- What is opening and closing stock?
- What is the recommended number of turnover days?
- What is turnover days and how is it calculated?
- Where do I change my food cost forecast?
- Why is opening and closing stock important?
-
- Can one employee work in two departments?
- How do I add a shift code?
- How do I copy hours into the unspecified row (Timekeeping system excluded)
- How do I create a rotating schedule?
- How do I make a new schedule?
- How do I navigate the tools in the schedule?
- What are timekeeping system (TKS) excluded hours for?
- How do I add a schedule to my cockpit?
- Do workers added in the schedule get carried over to future months?
-
- Do I have to change my budget & forecast manually every month?
- How can I see what the current cost driver is?
- How do I set a productivity goal?
- How does the cost driver effect my hours and productivity?
- Where can I find the upload function?
- Why are my budget and forecast locked?
- What is Room revenue planning?
-
- How do I copy to Live forecast?
- How do I submit my Live forecast to forecast?
- How do I reset the pickup for a full month?
- Why do I have a red triangle to the left of the date?
- What are Pickup statistics?
- What are covers?
- What are the seasons in PMI?
- What do the pickups show and why are they sometimes negative?
- What is a revenue driver?
- What is the difference between Forecast and Live forecast?
- Why does on the books in PMI not match what we have in our PMS?
- How do I calculate ARR and ADR?
-
- Can I edit the figures in the Flash report?
- Different view options in the Flash report
- How am I performing compared to my forecast/budget/last year?
- How can I print the report?
- How can I switch between viewing daily and monthly figures?
- How do I check what segments add to the total daily figure?
- How do I edit my covers?
- Why are my room/guest nights wrong?
- What is the Flash Report
- Why is my revenue wrong?
- How is the month-to-date forecast and budget calculated in the Flash report?
- Why are the numbers in the Flash report different from the Live forecast?
- Where can I see account mapping details?
-
- How do I know if the mapping is correct?
- How do I know where accounts should go in PMI?
- How do I map the categories in the timekeeping system (TKS)?
- I cannot see my department in Timekeeping System (TKS) mapping. How do I see it?
- There is a position missing in the Timekeeping system mapping. How can I fix this?
- What are Categories in PMI Timekeeping system?
- What is Departments in Timekeeping system (TKS) mapping?
- What is mapping accounts?
- What is mapping – timekeeping system?
- Why don’t I see the spoon and fork icon in account mapping?
-
KPIs
-
General user knowledge
-
Miscellaneous
-
Access system
- Articles coming soon
-
d2o team only
-
- Articles coming soon
-
- Articles coming soon
-
- Articles coming soon
-
- Articles coming soon
-
-
PMI adoption index


