Intro to NextGen GoGreen Planning
What is GoGreen planning?
Planning is a new module that initially supports the GoGreen cockpits with financial elements for environmental targets. This module is prepopulated using the latest Live forecast and estimates based on historical financial (P&L) data.
This article is geared toward department heads, controllers and GMs with access roles including budgets or forecasts and GoGreen. It focuses on understanding the different screen elements in the new prepopulated screen. For detailed instructions on how to make changes, see How to edit a plan.
How to begin
Planning process overview
The new planning module has a clear planning cycle that differs from the current PMI processes because it does not have a permanently available WIP version.
Planning process steps
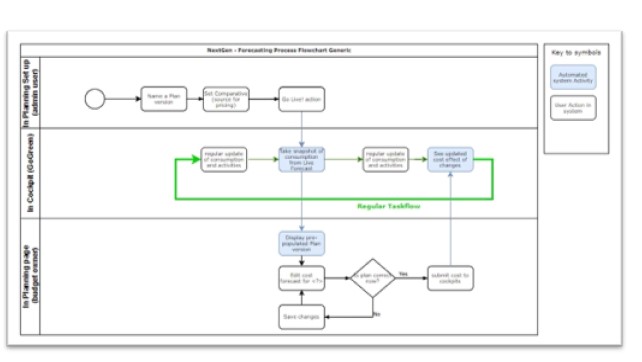
- Admin user sets the name and details and triggers a snapshot of Live forecast.
- PMI uses the snapshot and historic versions to prepare a prepopulated version.
- Department heads edit the prepopulated figures.
- The completed plan is submitted back to Cockpits when done.
Here is a more detailed flow chart to show the main steps in the process and who is involved. This view focuses on a plan of type forecast which updates the targets in GoGreen cockpits.
Screen Overview
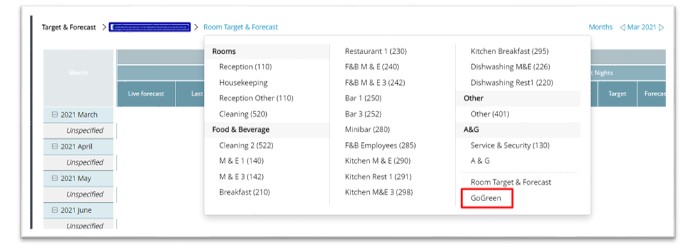
The planning screen is currently accessed from the Budget & Forecast page when you choose the dept GoGreen.
The planning screen works in the same way for any kind of plan available. A plan may be called a budget, forecast or target at your property or chain so we have used plan throughout this text as a generic term.
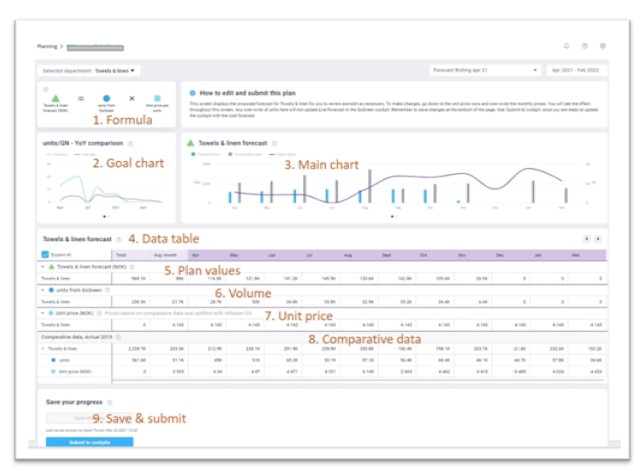
This document continues with notes on each of the numbered screen elements. Remember you can also get similar information in the screen at any point by selecting the question mark icon for the element you are interested in.
1.Formula
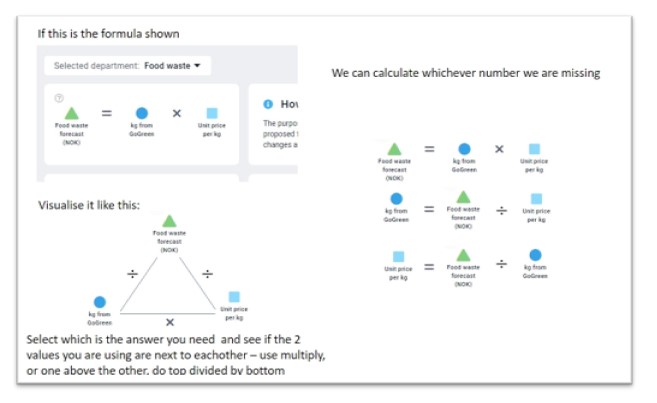
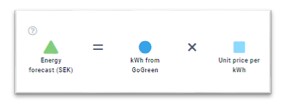
This displays the calculation or formula used to create the plan values throughout the page. The symbols used are reflected by the same elements in the data table. The diagram below shows the correlation between the formula elements which calculates the unit price to get the plan value you expect.
2. Goal chart
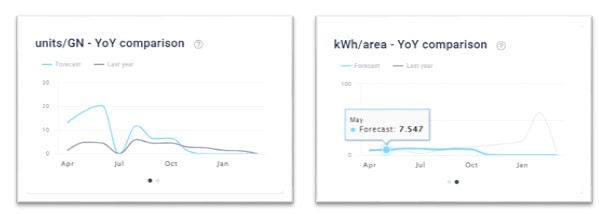
This displays whether your plan shows year-on-year (YoY) improvement, considering the activity levels. The plan values for each month are divided by a relevant productivity measure such as guest nights or hotel area in square meters and compared to the same calculation for the same month last year. It shows improvement (a reduced cost per guest night) where the blue line is lower than the gray one.
3. Main chart
Planning is not currently linked to P&L forecast and we will integrate this in a later feature release.
Screen Overview
The planning screen is currently accessed from the Budget & Forecast page when you choose the dept GoGreen.
Screen Overview
The planning screen is currently accessed from the Budget &a
Use this chart to see at a glance the general shape of your plan (blue bars) against the comparative period (gray) as pre-set and the level of guest nights planned (purple line).
This enables you to see if the cost level decreases when guest nights decreases or displays seasonality as expected.
If the chart looks too busy, you can always deactivate some of the information by clicking on the legend (label) for that item.
You can also switch from a monetary view to a consumption chart using the dots below the chart or hover over a data point to see the exact value for that period.
4. Data table general
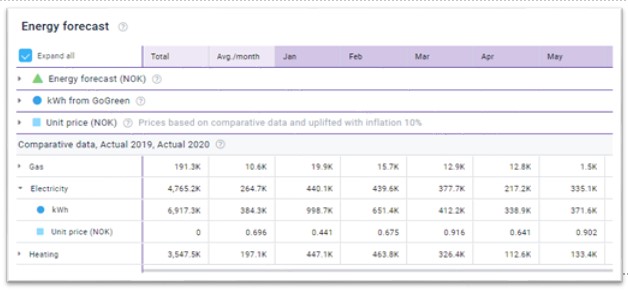
This is the traditional view of a budget with numbers by month. We have included a total column showing the sum of all months in the plan (which could be anything between 6 & 18 months). The column Avg./month is the sum of all months divided by the number of months in the plan.
Forecast page when you choose the dept GoGreen.
Where values are open to edit you can click in and then edit the value (get blue outline on current cell). As soon as you move away from the cell the totals and charts will update with the change. The cell gets a gray corner tag to indicate it has a pop-up. The pop-up shows the original value.
We have used a K to indicate numbers that are displayed in thousands to make the screen less cluttered. If you go in to edit you will see the whole value displayed so always type in the full number. Example 121.4k is displayed but when editing will see 121,436. You should always just type the number, and decimal point if relevant.
5. Plan values
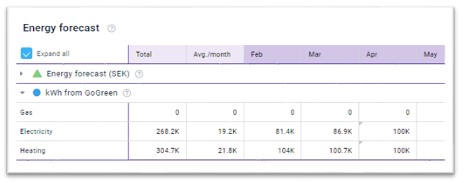
This first section in the data table is the plan (budget) numbers in the currency shown in the header. It displays in thousands (K) and in the local currency.
These values cannot be edited directly, they reflect values in the next sections based on the formula displayed at the top of the page. We have designed it to ensure we keep the model connected to productivity drivers and prepopulate plans with appropriate values. It should save you some effort in the long run.
6. Volume/usage/consumption
You can edit the values if you consider it to be inaccurate. However you are then required to update the same values in the Live forecast ensuring all is aligned.
7. Unit price
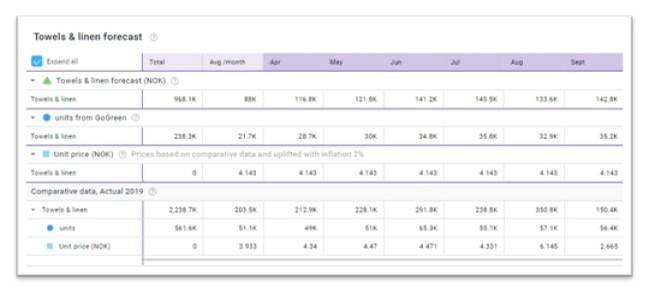
This shows an estimated average price for each month in the plan and is combined with the usage (multiplied) to get the plan values. You can edit these prices as required. You can see there is added a price of 1 for gas in most months below.
The header for this section includes a basic reminder of where the data shown comes from. It refers to a comparative data which is the section below. Here the comparative data is labelled as using values from Actual 2019 and Actual 2020. The header also specifies that the inflation uplift is 10%.
Calculations used to suggest a unit price for the plan periods
- In Energy – expect seasonal price variations – monthly.
- Historic actual cost for electricity (acc 6110 all depts) for given month
- Divide by historic consumption in kWh Electricity for given month
- In Other GG pages – expect stable price or estimate with annual correction – average
- Sum of cost in historic period
- Divide by sum of consumption in historic period
- If the source is a previous plan, then show monthly prices from the same month in that plan.
Finally adjust the resulting unit price up or down by a given % and display.
8. Comparative data
When the source is Actual data this section will display the cost for each month from the P&L (trial balance) for the month and the usage (kWh here) from the full-month cockpit figures. These are used to calculate and display a unit price using the same formula highlighted at the top of the page.
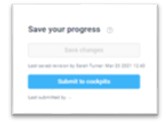
9. Save & submit functions
The ‘Save changes’ button will ensure your changes are saved for next time you or anyone else comes back to this plan. At this stage the values only exist in this view.
In order to make the plan values (cost of energy and estimated unit prices) available anywhere else they also need to be submitted using ‘submit to cockpits’. This button will send an update of the saved changes in all the pages (depts) of this plan at once. So far, the update is linked from any Forecast plan into the Targets in the GoGreen cockpits. Each time someone submits a Forecast page from these planning screens the targets in the GoGreen cockpits will be updated. You can easily follow up the need for any preventive or corrective actions during the month.

