Rooms Live forecast: Sense check mode explained
What is sense check mode?
Sense check is a feature to help minimize errors in your data. It highlights potential errors and values that seem extreme so you can review, correct or validate as needed. Sense check appears as an option on other pages in PMI that have data tables, including the new view of Rooms Live forecast.
How to use sense check in Rooms Live forecast
Sense check will show in both the ‘Table view’ or ‘Graph view’ for Rooms Live forecast. Click on ‘Sense check alerts in graph view’ in the table of contents to the left of this article to jump to that section for specific examples in ‘Graph view’.
Image: Sense check in Rooms Live forecast ‘Table view’ (points 1-3)
- The sense check will be turned on by default each time you open the Rooms Live forecast pages. You can turn it off for the current session by deselecting the check box. When sense check is on, you will see some cells in the data table are highlighted red or amber.
- Hover over any highlighted cell to view an explanation of why it was highlighted and to see the available actions. Note that you will also see the standard status information for that cell in the same pop-up.
- There are 3 actions that can be taken for each sense check alert:
-
-
- Keep alert: If you are not able to resolve this alert now but want to keep it available on the page, simply hover off the cell and the alert will stay active.
- Snooze alert: This will turn off the alert from your view of the Live forecast until there is a new import of data, or until the Live forecast is updated (typically next day). Note that this action is user specific so other users will still be able to see this alert. Use this option if you wish to monitor the OTB data for a specific date for a few days, or to come back to look at the Live forecast after the next update.
- Remove alert: This will permanently remove the alert from the cell for all users, and, once pressed, cannot be undone. However, if the values for that cell change significantly and cross into a different alert threshold, a new alert will appear. Use this option if you are sure the OTB or Live forecast values are correct.
-
Review each sense check and decide on the action as part of your daily check of Rooms Live forecast for the current month. It is also possible to review all the sense checks at once, instead of by the day. See section ‘Using the side panel to review all sense check alerts’ for more details.
Image: Different types of sense check alerts in Rooms Live forecast (points 4a-4c)
4. There are 3 main types of alerts for Rooms Live forecast.
4a. OTB values: This will check if the latest imported OTB for Room nights or ARR is within the range of values that PMI expects for the same day of the week, same season and same lead time from today’s date. The OTB values cannot be edited in the Live forecast, but you can take a closer look at the actual bookings, or the import, if there is a clear error in the data. The alert will appear in both Room nights and Guest nights view. If you are happy with the data, you can ‘Snooze’ or ‘Remove’ the alert to clear it from the page (see details above for these actions).
4b. Live forecast values: This will check the current Live forecast for Room nights or ARR and compare it to PMI’s own prediction for that day. You can adjust the Live forecast if you agree with the alert and want to bring the Live forecast more in line with PMI prediction. If you are happy with the data, you can ‘Snooze’ or ‘Remove’ the alert to clear it from the page (see details above for these actions). These alerts can only be reacted to in Room nights view.
4c. OTB Guest factor: This will check that the number of Room nights and Guest nights are appropriate for each other when compared to the average Guest factor for the same weekday, during the same season. It will flag if Guest nights are less than Room nights or if the Guest factor is significantly higher than the average. If you are happy with the data, you can ‘Snooze’ or ‘Remove’ the alert to clear it from the page (see details above for these actions). This alert is less common but will show on Room nights or Guest nights OTB cells.
Note: It will not show if there is an active OTB value alert for Room nights. Removing or snoozing an OTB value alert will allow any OTB guest factor alerts to show.
Sense check alerts in graph view
When Rooms Live forecast is opened in ‘Graph view’, there are highlights on each date that has a sense check.
Image: Sense checks in Rooms Live forecast in ‘Graph view’ (points 1-5)
1. The color of the highlight indicates the highest type of alert for that date. E.g., If there is a mix of priority and low alerts, the date cell will be red. If there are only low alerts, the cell will be amber.
2. Click on a day (date cell or bar in the graph) to open a pop-up with more details about the sense checks for that date.
3. The pop-up shows a data table of the Room night, ARR and Revenue values. Any sense checks for OTB or Live forecast will be highlighted.
4. Hover over any sense check highlight to see the full alert message and possible actions. Carry out any required actions from here in the same way as on the main data table when in ‘Table view’. See details about these actions in section above.
Note that ‘Snooze’ or ‘Remove’ take effect immediately and cannot be undone.
5. Press ‘Update’ before closing the pop-up to update any changes you have made to your Live forecast data.
Using the side panel to review all sense check alerts
If there are a lot of alerts for the month (or selected date period) these can be reviewed in a list rather than by individually hovering over them. This can be done in either ‘Table view’ or ‘Graph view’.
When ‘Sense check’ is enabled in Room night view, there is a side panel to the right of the Live forecast page.
Note: this is not available in Guest nights view.
Image: Access Side panel in ‘Table view’ or ‘Graph view’ to view sense checks as a list.
1. Click the blue triangle to expand the panel.
Image: Side panel gives list of all alerts for the selected date period (points 2-6).
2. With the expanded panel, the data table or graph can still be viewed. Scrollbars at the bottom of the page enable access to any data now hidden by the panel.
3. The table in the side panel lists all the active alerts in your selected period. If there are more than 30 alerts, use the ‘Load more’ button in the side panel to load the next 30 rows.
4. In the data table, scrolling for the main page and side panel can be controlled individually to allow you to view any alert alongside any row of data.
5. The table in the side panel has the following columns:
-
-
- Date: The date being forecasted which has an alert. The list is sorted by date.
- Data field: The column in the data table which has the alert. The columns are Room nights OTB, ARR OTB, Room nights Live forecast and ARR Live forecast.
- Value: The actual data value (either number of Room nights or ARR). This cell is highlighted in amber or red to indicate if it is a low priority or high priority alert.
- Alert message: The same message that would appear if you hovered over an alert. This explains why an alert has been triggered and the expected values.
- Alert action: (Keep alert, Snooze alert, Remove alert). The default action is always ‘Keep alert’. To snooze or remove any alerts in the list, click on the relevant option for that date.
-
6. When you click ‘Snooze’ or ‘Remove’ for an alert in the side panel, it will stay in the list until you press ‘Save’ at the bottom of the panel.
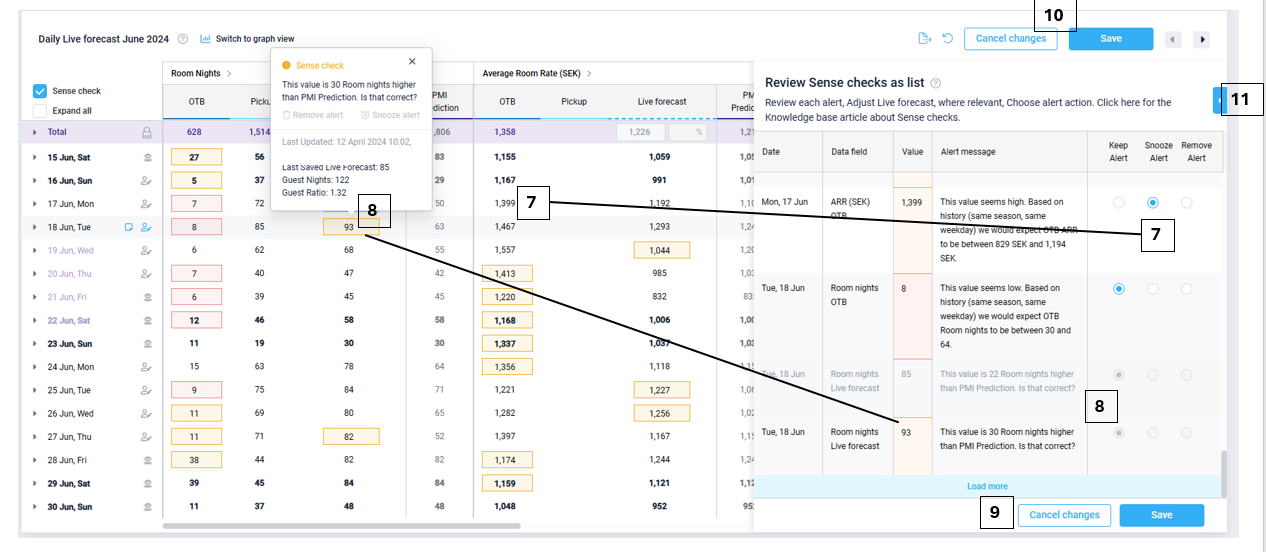
Image: Interaction between side panel and main data table (points 7-11)
7. Alerts that are snoozed or removed in the side panel will immediately be hidden on the data table (or graph) to show progress through the list. They can be re-activated by changing the status back to ‘Keep alert’ in the side panel before you save the panel or by pressing ‘Cancel’ at the bottom of the panel. Once the side panel is saved, changes to an alert status cannot be undone.
8. You can continue to edit your Live forecast (for dates where Manual edit is enabled) while the side panel is open. Changes to your Live forecast data will update your sense check alerts. This is shown both on the page and in the side panel list. The old alert will be grayed out in the list with the new alert (if any) appearing beneath it.
If you have unsaved changes to your Live forecast values on the main page, you will not be able to snooze or remove an alert.
9. Remember to save (or cancel) any changes in the side panel before closing it.
10. Any changes to the data (e.g. Live forecast) will still need to be saved on the main page.
11. Click the blue triangle to close the side panel.
Alert overview (12 months)
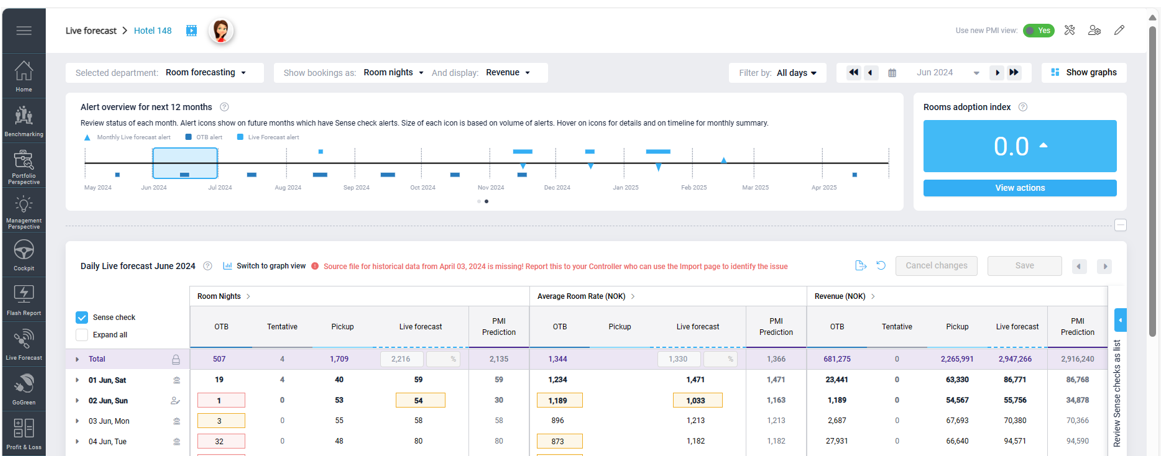
There is an overview chart which shows how many alerts there are for each calendar month for the next 12 months. Use this chart as part of your weekly or monthly review of the upcoming months.
The chart is accessed by clicking the 2nd dot at the bottom of the Summary chart panel.
Image: Alert overview chart on Rooms live forecast page
The timeline shows 12 months starting with the current month. The selected date period for the main page is highlighted in blue on the timeline. Changing the selected date period will update the highlight. Hover over the timeline and icons to see different information relating to the alerts. Click on the timeline to choose that calendar month as the selected date period. This will refresh the whole Live forecast page.
The chart gives 4 main types of information:
Image: 4 different tooltips available on the Alert overview chart
1. Calendar month summary: Hover over the black timeline to get a pop-up with summary information for that month. This summary shows the current Live forecast values for Room nights along with the Room nights values for Forecast and PMI Prediction.
2. Month live forecast alert: If the Live forecast for a month differs significantly from PMI prediction, this is indicated by a blue triangle on the line. The greater the difference, the bigger the size of the triangle. If PMI prediction is higher than the Live forecast, the triangle points up. If it is lower, the triangle points down. Hover over the triangle to see the details.
3. Live forecast (daily) alerts: A light blue block above the timeline indicates that the calendar month has several (daily) sense check alerts in the Live forecast. This could be room nights or ARR, and a mix of red or amber alerts. The more alerts there are, the longer the bar. Hover over the bar for details of how many red (high priority) or amber (low priority alerts there are in that month.
4. OTB (daily) alerts: A dark blue block above the timeline indicates that the calendar month has several (daily) sense check alerts in the OTB columns. This could be for Room nights, ARR values, or the Guest factor on room nights, and includes a mix of red or amber alerts. The more alerts there are, the longer the bar. Hover over the bar for details of how many red (high priority) or amber (low priority alerts there are in that month.
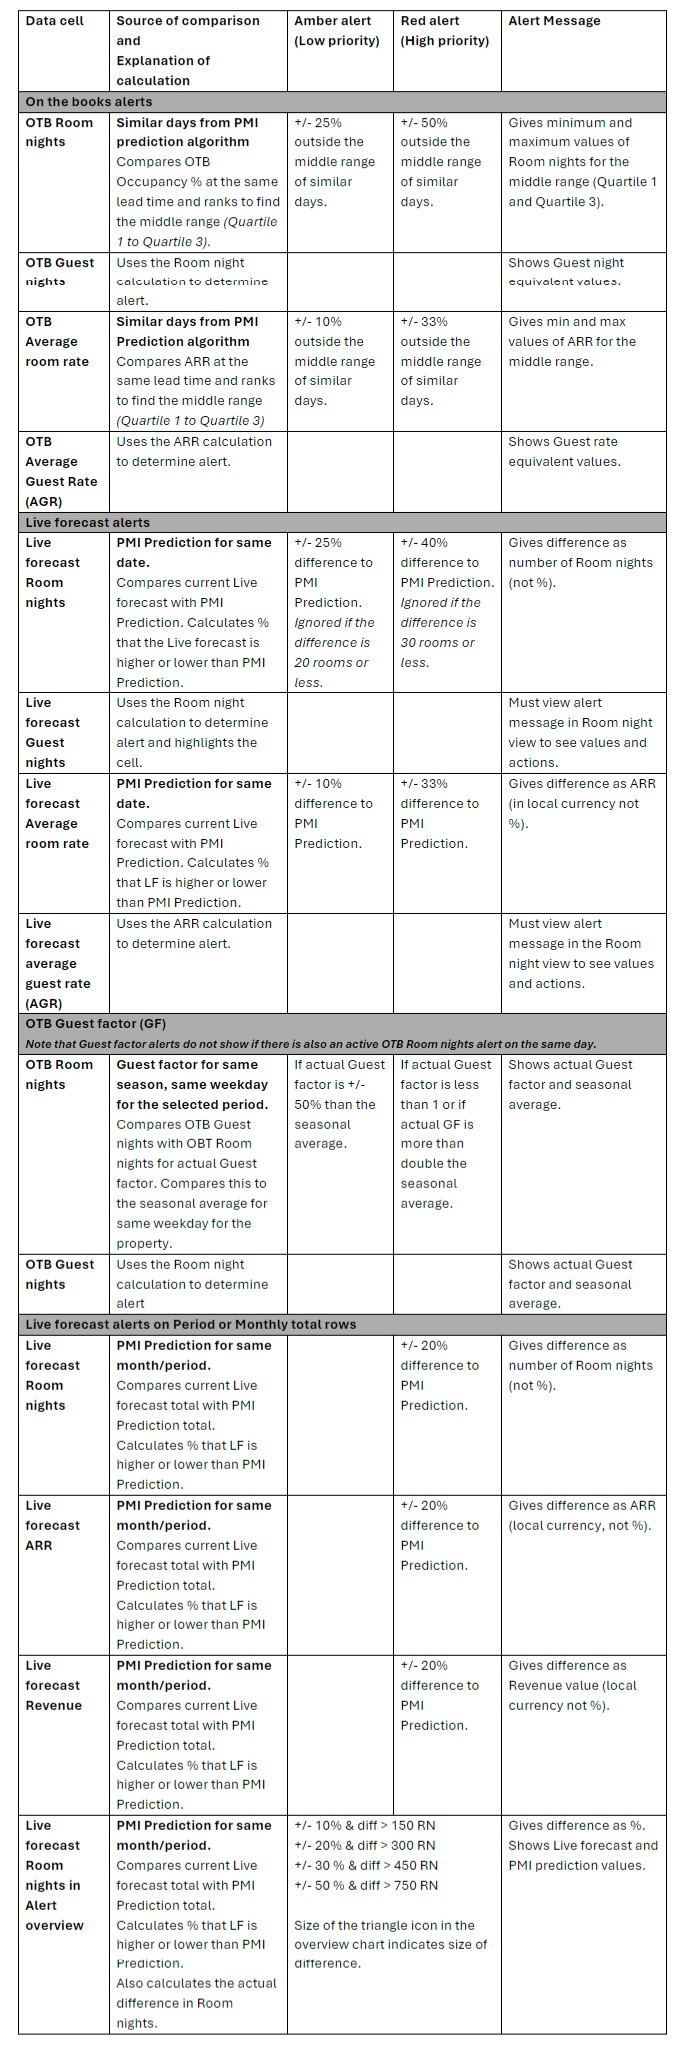
What is the threshold for each type of sense check?
There are standard thresholds for each type of sense check. These determine whether the data values are within expectation (no alert), are somewhat outside expectation (low priority/amber alert) or further from expectation (high priority/red alert).
See the table below for the calculation and threshold for each type of alert.


