GoGreen Doing Cockpit overview
Navigating the GoGreen Cockpit
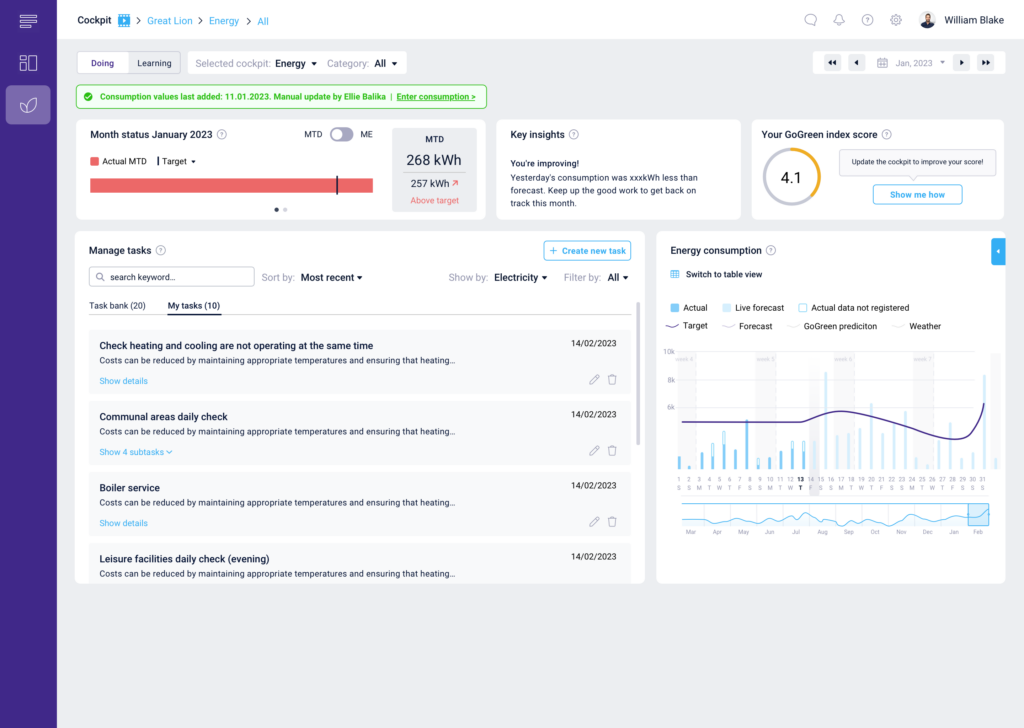
The GoGreen Cockpit serves as your central hub for monitoring and managing your property’s environmental resource consumption. Unlike other cockpits, its layout is specifically designed to focus on sustainability metrics.
- Top navigation: Begin by selecting the desired resource category—such as Electricity, Heating, Cooling, Water, Food Waste, or Chemicals—from the top navigation bar. This selection determines the data displayed in the cockpit.
- Date selector: Adjacent to the resource selection, use the date selector to choose the month you wish to analyze. By default, the current month is displayed.
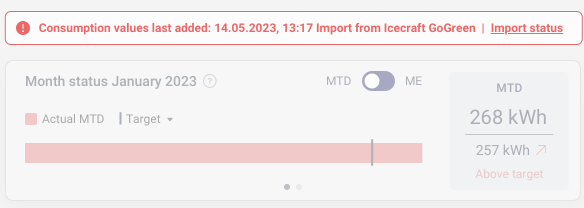
- Consumption alert: A prominent alert indicates the status of your data updates. A green alert signifies that actual consumption data is up to date, while a red alert indicates missing or outdated data, prompting immediate attention.
- Progress bar: Below the alert, a progress bar visually represents your consumption against set targets or forecasts, providing a quick assessment of performance.
- Graph and data toggle (bottom right): The main consumption chart visualizes actual, forecasted, and target usage for the selected metric—plus weather and GoGreen prediction lines. You can switch to a table view using the toggle at the top of this chart to see detailed daily consumption data for deeper analysis.
- Task manager (bottom left): The Task Bank translates insight into action, offering suggested tasks to reduce resource use—like HVAC checks or operational changes. Tasks are filterable, assignable, and trackable.
Need to analyze trends and learn from past performance?
Click the “Learning” tab at the top to switch to the GoGreen Learning Page, where you can assess historical data, peak usage, and misalignment insights to improve your future results.
What is the GoGreen Cockpit?
Each GoGreen Cockpit enables users to record, monitor, and manage specific sustainability metrics and environmental resource consumption for their property.
Resources include Energy, Chemicals, Food waste, Water, Waste and Towels & Linens.
The owner of the cockpit is usually the maintenance manager of the property.
What is its purpose?
The purpose of GoGreen cockpits is to give users easy oversight of:
- Is my actual consumption data up to date?
- Am I on track to meet the monthly consumption Forecast/Target set?
- If no, what actions should I take to reduce resource consumption?
Top tips for getting the most from your GoGreen cockpit
View the cockpits regularly – at least once a week. As you do this, complete the following steps:
- Validate that the consumption data is up to date (check that the alert is green).
- Review month status. Are you on track to meet the forecast/target set? (Check that the progress bar is green.)
- Identify what days are having the biggest impact on the result.
- Review tasks and consider what additional tasks to implement.
- If you have implemented tasks, review the impact of these. Were they effective, or do you need to change approach for the coming month?
How to use the screen
Navigation
Select the resource you want to view, such as electricity or water. You can also select a specific category if needed. Use the date selector to choose the month you want to view; the current month is shown by default.
Consumption alert
To ensure that your GoGreen Cockpits display accurate and actionable insights, actual consumption data must be updated regularly in PMI. A status message at the top of the cockpit indicates when actual data was last received:
- Green means the update is within the expected timeframe.
- Red signals that data is overdue or partially missing.
Note: The expected update frequency depends on your setup — either daily or monthly, depending on your data import schedule.
- For cockpits with an automatic import feed, click the Import status link to view the current import log and investigate any issues. If you don’t have access, please contact support.
- For cockpits requiring manual entry, click the Enter consumption button to input values directly. Select your preferred unit (kWh or MWh) and timeframe (monthly or yearly).
Need help? Click the question mark icon on the screen for guidance on completing the fields.
Month status
The progress bar allows you to compare your actual consumption with the forecast or target (if available).
You can view this MTD (month to date) or month end. When month end is selected, the actual bar uses actuals month to date and the Live forecast for the rest of the period. If actual data is not yet available, predicted values will be used based on historic patterns and the expected activity at the hotel.
The color of the arrow indicates if you are on track to meet the goal or not. The direction of the arrow indicates if you have improved since yesterday.
You can also view the details as a cost by selecting the 2nd dot on the bottom of tile.
Key insights
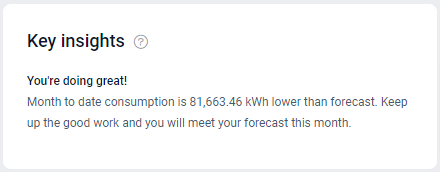
A comment is given to summarize what you can see in the progress bars in text format, and highlights the key difference between forecast and actuals.
The comment will be updated each morning.
GoGreen index score
GoGreen indicates how effectively you are using GoGreen module in PMI to effectively manage resources at your property. The score shown is the cockpit’s most recently calculated score. This is updated daily. The goal is to have a score of 8/10 or above. Click the link to view the GoGreen index dashboard where you can get insight into what is needed to increase your score.
Manage tasks
Use this section to plan what actions you will take to reduce consumption and track completion. Browse ideas added by colleagues from the task bank section. If you want to commit to a task, select ‘Add to my tasks’.
1. Track task status updates in My Tasks:
-
-
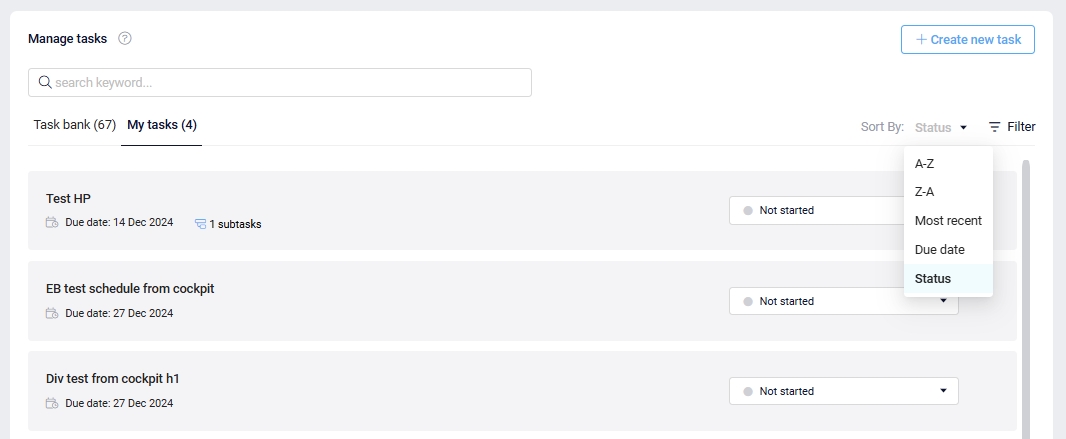
- Maintenance managers can update the status of tasks directly in the My Tasks tab.
- Status options include Not Started, In Progress, and Completed.
- To remove them from the list, select Delete.
- Create additional tasks by selecting ‘Create new task’.
- Once marked as Completed, tasks are moved to the bottom of the task list.
-
2. Schedule tasks with due dates:
-
-
- Tasks scheduled by chain managers now appear in the My Tasks tab with a clear due date.
- These tasks cannot be removed or hidden until marked as Completed.
-
3. Due date alerts:
-
-
- Overdue tasks trigger a red alert in the Key Insights section of the cockpit.
- Alerts display the task title and the number of overdue tasks.
-
Note: Any new tasks created will be submitted to head office who has the option to add them to the general task bank for all users to learn from your good ideas.
Use the filters to organize the task bank. You can also ‘like’ a task by selecting the thumbs up.
Resource consumption graph
- Daily target is displayed as a purple, horizontal line. Click here to learn more about how the target is calculated.
- Actual data is the imported consumption from your supplier or is manually entered.
- Actual data not registered is predicted values for past days with no data. An estimation of your consumption is displayed instead of showing a zero value until PMI is updated with actual data.
- Live forecast is a prediction of the consumption for upcoming days and months based on
your historical trends and upcoming hotel activities.
-
- You can change the period to a different month in the date picker. You can also slide the gray box in the year view below the graph to the month you wish to view.
- You can choose what you want to be included in the graph by clicking on them in the legend.
- Today’s date is encased in a gray box with the day highlighted.
Hover over a daily bar for past days to see the date and time of the last data import.
Review the graph for a daily breakdown of consumption compared to forecast. Use this to identify if there are specific days in the month where consumption was significantly over or under forecast or target, and consider reasons for these fluctuations. Are there actions that can be taken in the future to improve the alignment to the forecast?
You can also view the data in a table format. Table format also includes data on Room nights, Guest nights, Weather and Meetings & events. These data points may help identify why any big changes in consumption occurred.
Calculation used for Meeting & Event business:
- No business: a zero
- Low: Lower than 25% of daily revenue, median over the last 12 months
- Medium: 25% – 75% of daily revenue, median over the last 12 months
- High: >75% higher than the daily revenue, median over the last 12 months
Select the arrow on the side to expand the graph to full size. Select again to shrink.


