Staffing screen overview
What is its purpose?
The planning staff module enables you to review and adjust staffing to meet demand (SMART forecast) all in one screen. The goal is to reduce manual workload and make forecasting less error-prone. You can import scheduled hours and base salaries from an external system(s) and forecast down to the individual staff member level.
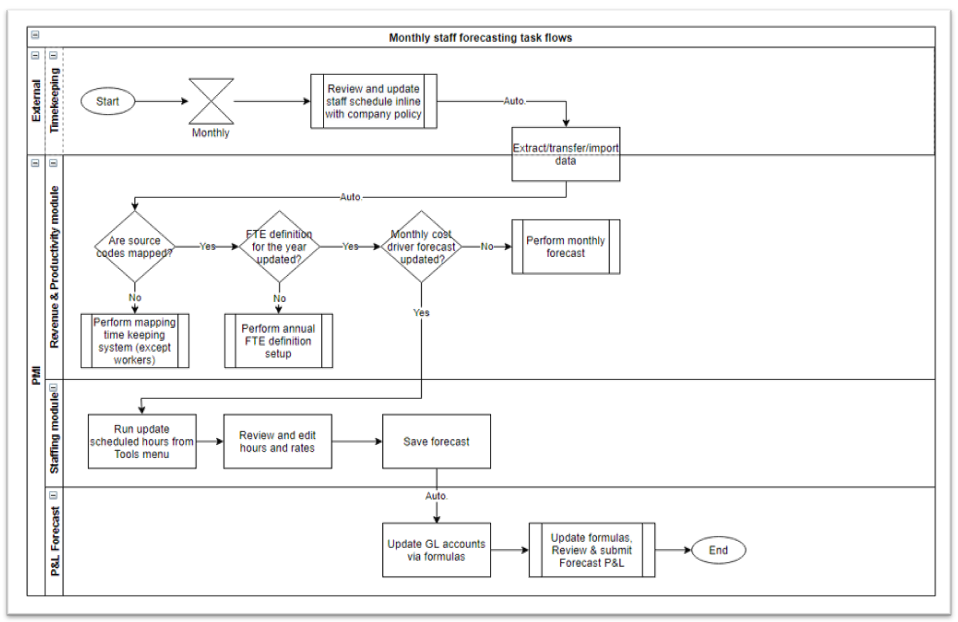
Below is a full flowchart of the task flows for Monthly staff forecasting
Mapping
The flow chart is intended as a reminder of the overall process to support troubleshooting if there are unexpected results. The decision points shown are for the different data settings that affect the results and should be checked regularly.
Staffing screen overview and definitions
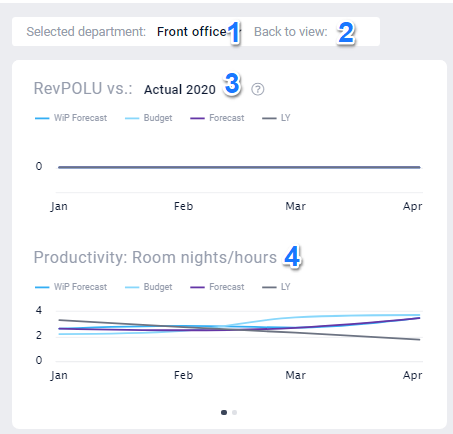
Section 1: Quick view graphs
- Selected department – Choose the department you want to work with.
- Back to view – Click here to return to the other Profit & Loss views: Accounts, Account summary, and Report.
- RevPOLU vs Actual YEAR – Here you see how RevPOLU for the specific department compares to budget or forecast and to actual historic data (select a year to view). The chart uses the first revenue-based cost driver specified in the cockpit for the department. It is blank If there is no revenue based driver defined. Hover over the graph to see a snapshot of the values.
- Productivity Room nights/hours – Here you see how the productivity for this department compares to budget and historic data (selected year) using the cockpit productivity driver divided by hours. When you hover over the graph you see a snapshot of the information. The productivity chart uses the main cost driver specified in the cockpit for the department. Click on the dots to switch between four-month and annual views.
Section 2: Staff forecast hours chart
- Click here to choose what you want to work with. It could be your current work in progress (WiP) Budget or Forecast or you can view an approved Budget or Forecast.
- The date picker, select which period you want to review.
- Staff forecast – hours chart, here you can view if the total planned hours from fixed and flexible staff match the cockpit’s SMART hours plan. The bars show how substantial the overstaffing (dark orange) or understaffing (light orange) is in hours. By adjusting hours against staff in the Staff forecast table, you can reduce these differences and schedule the optimum staffing levels. (see article Edit and update using the staffing tool).
- Ideally, the purple line for expected demand should match the top of the blue area – then the scheduling matches the SMART forecast. Hover over the graph to see exact values for a month, or see the data table below it on the screen.
- Below see definitions for terms used in the graph. Please note, the wording used can vary from property, country, hotel chain etc.
- Fixed staff / paid a fixed monthly salary (dark blue line in the graph) – Here the TKS import provides a monthly salary amount. To display an hourly rate, this is divided by FTE hours. If you have part-time staff, for example, staff with fixed contracts less than 100% then the import must contain a pro-rata salary.
- Flexible staff / paid an hourly rate (light blue line in the graph) – Here the TKS import provides an hourly rate which is displayed directly.
- Hours – these are hours imported for a specific name and are the total sum of productive and non-productive scheduled hours for each month. It uses the same Mapping – Timekeeping system (TKS) as cockpit hours. This means some monthly schedules may include more non-productive hours and appear overstaffed compared to the SMART forecast.
- SMART forecast hours (purple line in the graph) – Hours from your SMART forecast.
Section 3: Data table – summary hours section
- Staff forecast table – This table has a summary, and then details per person showing how the staffing schedule looks in hours and cost. Local currency is used. When a month is imported (run from Tools. See How to edit and update using the staffing tool.), all existing data will be cleared out to show only the imported schedule. You are still able to make changes if required.
- Expand all – depending on what you going to work on you are able to expand and collapse the rows to see hourly rates.
- Sense check – by activating (tick) it will highlight any data that seems incomplete or illogical. In our example you can see that the hours in the column Feb needs attention. Use this to make sure there are no errors in your planning. For more details. see the article Sense check mode explained.
- Summary hours – This shows the total hours being forecasted for a specific department, which is the sum of hours listed below for each staff member. Expand the view to see the split of Fixed and Flexible.
Section 4: Data table – summary pay section
- SMART forecast (Room nights) – This shows how many hours should be scheduled according to the SMART forecast for this specific cockpit. In brackets is a reminder of the driver used (driver multiplied by productivity target equals hours shown here). If this line has 0 (zero) in future months, it may indicate the cost driver (room nights, covers, etc) has not yet been forecasted for the period. Check the relevant cockpit.
- Understaffing / overstaffing – This shows how many hours should be added (if understaffed) or removed (if overstaffed), in order for a schedule to be aligned with the SMART level of hours for the forecast activity (driver) levels. Please note that an accurate forecast will not always match the SMART hours’ line.
- Summary basic pay – This shows the total cost forecast for basic pay. Staff is split into Fixed and Flexible depending on the settings in your timekeeping system (TKS).
- Columns showing a padlock contain data imported from TKS schedules. Only future months can be unlocked for editing. When a month has passed it cannot be edited.
- Columns where there is no padlock means nothing from TKS has been imported and you can edit values directly.
- Save – Always press save when you have completed your tasks.
The cost shown – cost is the hourly rate multiplied by scheduled hours in each department. Cost does not include payroll-related costs, social costs, overtime, etc, and will only match the final salary cost line where hours imported agree to Full-time equivalent (FTE) hours. This enables us to show the same hourly rate for a staff member in all departments where they are scheduled. We can use the imported information, irrelevant of how many departments a staff member has worked in, the same hourly rate will apply in every department.
For future months where salary is not yet imported, the screen will display the same hourly rate used for the last available month. This means that if you have imported three months, June, July, and August. Then we use the hourly rate paid for the current month, which would be June, as a guideline for the upcoming two months for future salaries.
Section 5: Data table – Fixed staff
- Fixed – This section shows all the hours scheduled in a specific department for staff paid on a fixed salary basis. The hourly rate shown uses basic monthly and the standard FTE hours for the month to calculate a rate. Note that the overall cost shown on the name line (staff members’ names) will not match the actual salary if the scheduled hours imported do not match standard FTE hours.
- Unspecified – This is a generic field and can be used to add more shifts/hours in the forecast when you don’t know who will be taking the shifts. This can be a lump sum. This is great to use when you have to forecast further into the future. It will never be populated in imports from TKS. Remember to add an average hourly rate for these hours.
- The 3 blue dots appear when you have written in a note that you want to remember for future reference.
- The 3 gray dots appear when values have been edited manually.
Section 6: Data table – Flexible staff
- Flexible – This section lists all the hours scheduled in a specific department for staff paid on a flexible (hourly paid) basis. The hourly rate shown is imported from the TKS. It does not include overtime, bonus, etc. Payroll-related costs should be forecasted separately on the P&L WiP Forecast page as required.
- Unspecified – This is a generic field and can be used to add more shifts/hours in the forecast when you don’t know who will be taking the shifts. This can be a lump sum. This is great to use when you have to forecast several months into the future and don’t know who will be allocated the hours yet. It will never be populated in imports from TKS. Remember to add an average hourly rate for these hours.


