KPI targets overview
What are the KPI targets in PMI?
KPI targets allows you to track the property’s performance by comparing actuals against the set KPI targets, forecast and budget.
In the future, this will also enable hoteliers to compare and benchmark, not only within a group, but also against industry average and peers.
The data is updated monthly, once the actuals for the previous period become available in PMI.
There are multiple view options as well as an option to export data.
Viewing, reporting and downloading is primarily done by GMs, regional directors, controllers, and users at head office.
How to use the screen
The KPI targets module is accessed via the main menu.
Use the date selector in the top right of the page to choose the period to review. The current year will show as default.
Views
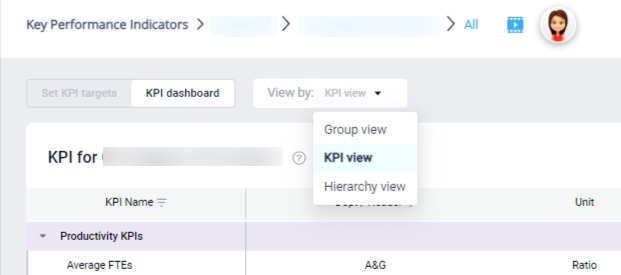
There are three different views that can be used:
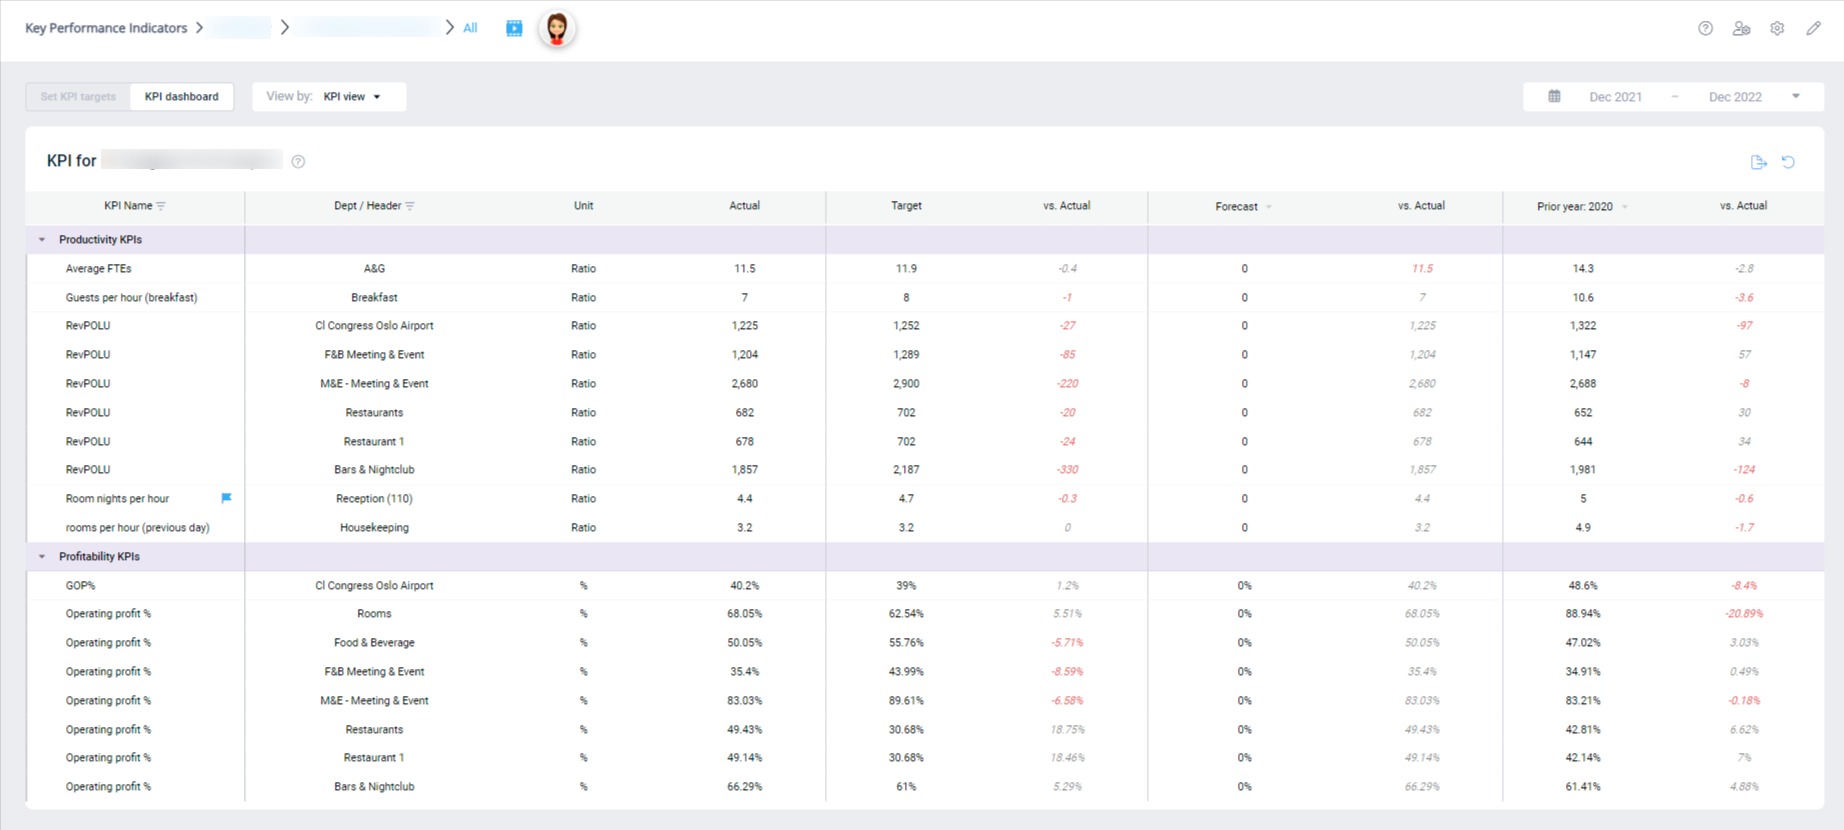
- Hierarchy view: This view is best if you want a quick overview of a single property’s performance as a whole. It lists all the property KPIs in order of the hierarchy as set up in Settings.
- KPI view: This view lists KPIs in alphabetical order, allowing you to compare the same KPI for each department, side by side.
- Group view: This view will allow you to view a KPI across all properties, divisions and departments in a group.
Columns
KPI Name: Displays the KPI name. Click on the row to view a tooltip with additional explanation of that KPI. KPIs with a blue flag are displayed in the relevant departments labor cockpit. The blue flags can be activated via the Personal view settings in the top right corner of the screen.
Dept/Header: Displays the department, division or property to which the KPI applies.
Unit: Indicates what kind of value is being displayed.
Actuals: The KPI is calculated using actual data for past months. For the current and future months, data from the last submitted forecast is used. Actuals will be used once they are available in PMI. The date is determined by the cut-off days specified in Advanced settings.
Target: This column contains the targets that were set in the ‘Set KPI targets’ tab.
Forecast: The KPIs are calculated automatically by using amounts from the last submitted forecast for each month. Click the header to use an older forecast.
Prior Year: View results from any of the past 5 years subject to data availability. The default shown is the prior year to the selected period. Click the column header to change the year being viewed.
Vs. Actual: These columns show the difference between actuals and the comparative data (either target, forecast or prior year). Values in red indicate that actuals are performing worse than the comparative selected.
Filters
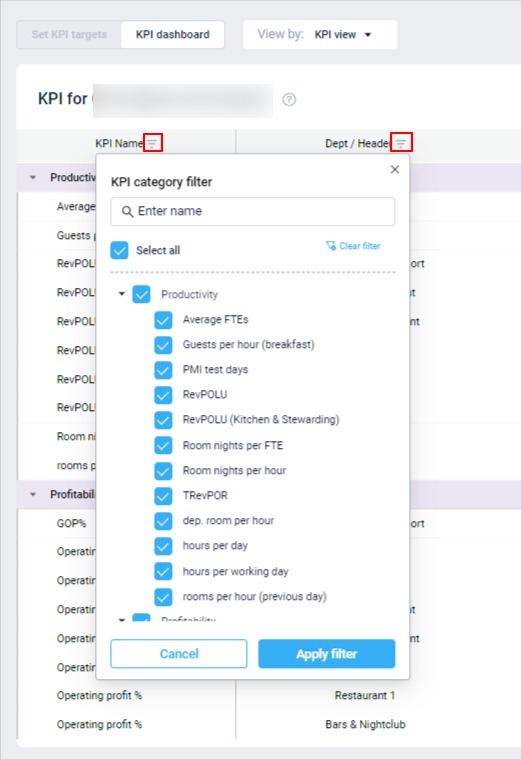
Select the filter icon by column headers to apply a filter. If the icon is blue, a filter has already been applied to that column. Any filters applied will remain if you leave and return to this page.
- KPI category filter: In this filter, you can choose which KPIs you want to view. KPIs will be grouped per category and listed alphabetically.
- Department filter: With this filter, you can choose the specific department you want to view. Departments will be listed in the same order that the alternative hierarchy has been set up.
- Property filter: This filter is only available in Group view. All the properties in the group that was selected will be listed alphabetically.
You can also reorder the columns by dragging the headers to the desired place. If you want to hide a column, simply remove Select the reset icon in the top right corner.
To export the data, select the export icon in the top right corner. You can export either to Google Sheets or Microsoft Excel. All data shown in the table will be visible in the export file. Note – the export file respects the filters set. If you need to export a full data set, ensure that no filters are applied to any columns.
How to view KPI details
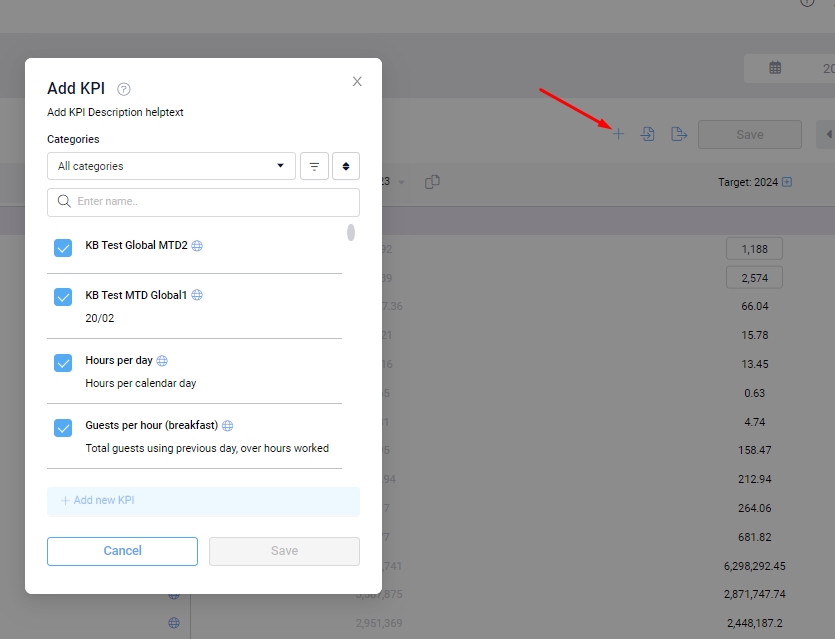
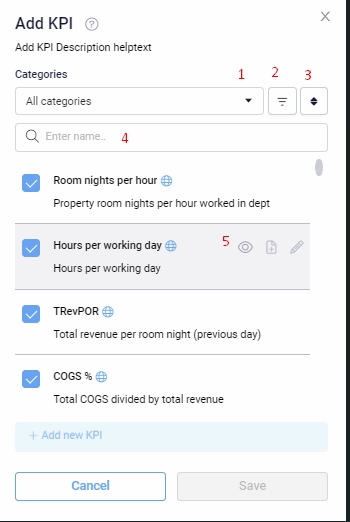
From the Set KPI targets tab , you are able to take a closer look at your KPIs. Click on the + sign by the Save button to open the pop up.
A blue checkmark to the left of the KPI means the KPI is active in your page.
The KPIs can be filtered based on the category selected in Settings (1).
- There are several options to filter (2), and sort (3) the KPIs.
- If there is a globe beside a KPI, that means it is a global KPI, created by d2o and it will be available for every chain and property in PMI, not just your specific chain. A global KPI cannot be edited or deleted.
- Chain means that this KPI is only available for your chain.
- In the search bar, you can search for a specific KPI (4). Typing the first 3 letters will start the search, bringing up all relevant options.
- Hover over a KPI and click on the eye icon to see more details (5).
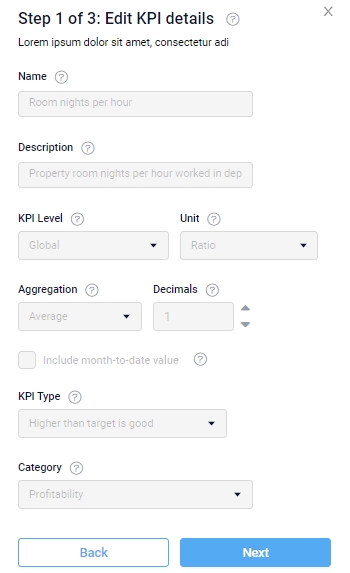
Step 1
Here you can see exactly which options were selected for this KPI. If everything is gray, no changes can be made. Select Next to go to Step 2.
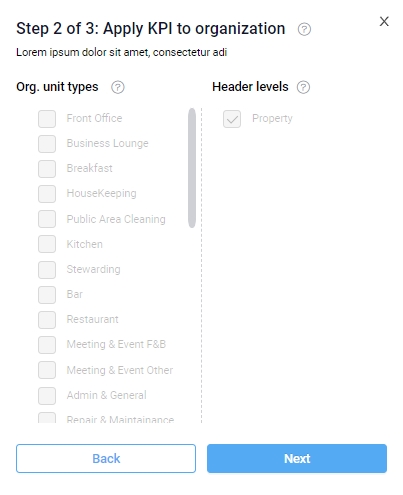
Step 2
Here you can see which organizational unit or header level the KPI has been assigned to. Open the dropdown beside the org. unit to view the specific departments. Select Next to go to Step 3.
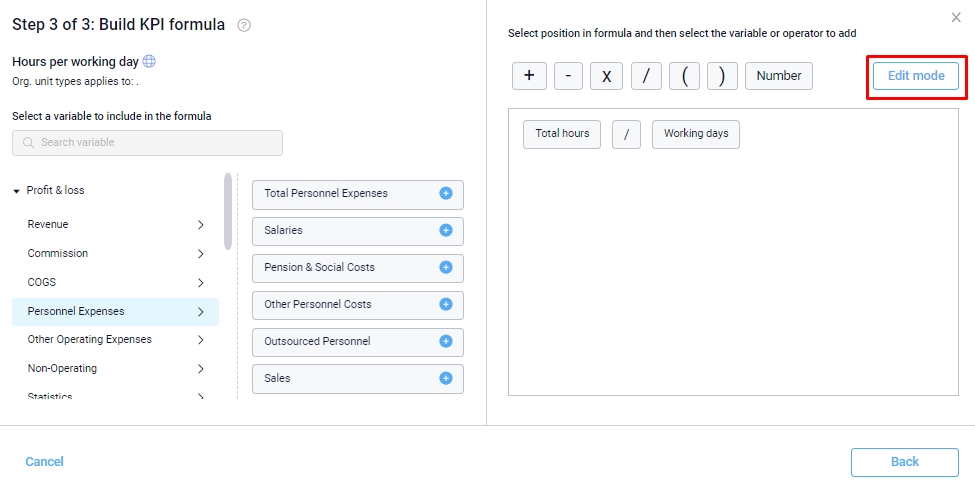
Step 3
The calculation for the KPI and what it is composed of can be seen here. Nothing can be added, edited, or moved on this screen. If the KPI has been linked to a different period or department, that will be written below the KPI.
KPis are meant to enable consistent comparisons in the chain. If any changes need to be made, please contact your HQ controller.
-
Getting started
-
-
- Arrivals/Departures
- Data elements required from PMS
- Manual Export PMS – Fidelio
- How to do a manual PMS export from Opera
- Manual Export PMS – Picasso
- Manual Export PMS – Protel
- Manual Export PMS – Spirit Web
- PMS – Cenium
- PMS – Citybreak
- PMS – Fidelio
- PMS – Opera
- PMS – Protel
- How to do a manual PMS export from HotSoft
- PMS – Skidata
- How to set up an Opera reports export
- PMI API
- PMI API Best Practice Get Forecasted hours
- PMI File Agent setup and documentation
- Technical specification for data integration
- How to transfer data to PMI
- How to enable Opera Cloud reports
- PMI system integration overview
- Import status overview
- Handling Outstanding Imports (Missing Data) in PMI
- How to read the import status page
- Opera Scheduler setup - Reservation Statistics 1
- Opera Scheduler setup - Report Trial Balance (trial_balance)
- Opera Scheduler setup - Reservation Forecast, (res_forecast)
- Opera Scheduler setup - Reservation History & Forecast (history_forecast)
- Opera Scheduler setup - Daily Forecast Report
- Opera Scheduler setup - SFTP transfer guide
- Manual Export PMS Opera
- Report 1 (manual export): Reservation Statistics 1 (res_statistics1)
- Report 2 (manual export): Reservation Forecast, (res_forecast)
- Report 3 (manual export): Trial Balance (trial_balance)
- Report 4 (manual export): Reservation History & Forecast (history_forecast)
- Show all articles ( 7 ) Collapse Articles
-
Video tutorials
-
- Administration Labor cockpit [14:49]
- Bar and Pub Labor cockpit [12:21]
- Breakfast Labor cockpit [12:05]
- Consolidated view in Benchmarking and Management Perspective [3:20]
- Flash Report Onboarding [6:27]
- Flash report overview [2:25]
- Food cost cockpit [6:21]
- Kitchen Labor cockpit [11:28]
- Labor Cockpit Onboarding [18:16]
- Labor cockpit overview [3:12]
- Live forecast 1/5 navigation [5:05]
- Live Forecast 2/5 Rooms [5:05]
- Live forecast 3/5 meeting & event [5:40]
- Live forecast 4/5 food & beverage [6:11]
- Live forecast 5/5 breakfast [7:19]
- Live forecast onboarding [6:06]
- Live forecast overview [2:58]
- Management perspective overview [3:06]
- P&L Planning 1/10 Purpose and benefits [2:25]
- P&L Planning 10/10 How to approve forecast and budget or target [2:34]
- P&L Planning 2/10 Navigation [4:26]
- P&L Planning 3/10 How to build a total [4:29]
- P&L Planning 4/10 Three ways of inserting figures [4:32]
- P&L Planning 5/10 How to add a sub account [1:42]
- P&L Planning 6/10 How to build a constant [2:42]
- P&L Planning 7/10 Staff module [2:48]
- P&L Planning 8/10 How to add a staff member [1:33]
- P&L Planning 9/10 How to revise and submit a forecast [3:01]
- Repair and Maintenance Labor cockpit [13:01]
- Restaurant Labor cockpit [12:30]
- Schedule 1/8 Navigation [5:12]
- Schedule 2/8 How to create a labor cockpit schedule [4:29]
- Schedule 3/8 How to add a team member [2:07]
- Schedule 4/8 How to create a shift code [3:30]
- Schedule 5/8 How to add shift codes to team members [3:41]
- Schedule 6/8 How to create a rotating schedule [3:20]
- Schedule 7/8 How to replace shift codes for a period [2:00]
- Schedule 8/8 How to create split shifts between departments [2:42]
- Stewarding Labor cockpit [11:38]
- Timesheet Onboarding [4:14]
- Show all articles ( 25 ) Collapse Articles
-
- Articles coming soon
-
- Administration Labor cockpit [14:49]
- Bar and Pub Labor cockpit [12:21]
- Breakfast Labor cockpit [12:05]
- Food cost cockpit [6:21]
- Front office Labor cockpit [12:05]
- Housekeeping Labor cockpit [11:20]
- Kitchen Labor cockpit [11:28]
- Labor Cockpit Onboarding [18:16]
- Labor cockpit overview [3:12]
- Repair and Maintenance Labor cockpit [13:01]
- Restaurant Labor cockpit [12:30]
- Schedule 1/8 Navigation [5:12]
- Schedule 2/8 How to create a labor cockpit schedule [4:29]
- Schedule 3/8 How to add a team member [2:07]
- Schedule 4/8 How to create a shift code [3:30]
- Schedule 5/8 How to add shift codes to team members [3:41]
- Schedule 6/8 How to create a rotating schedule [3:20]
- Schedule 7/8 How to replace shift codes for a period [2:00]
- Schedule 8/8 How to create split shifts between departments [2:42]
- Stewarding Labor cockpit [11:38]
- Timesheet Onboarding [4:14]
- Show all articles ( 6 ) Collapse Articles
-
- How to create a pre-populated new plan for Budget or Forecast [3:02]
- How to edit a plan [3:52]
- P&L Planning 1/10 Purpose and benefits [2:25]
- P&L Planning 10/10 How to approve forecast and budget or target [2:34]
- P&L Planning 2/10 Navigation [4:26]
- P&L Planning 3/10 How to build a total [4:29]
- P&L Planning 4/10 Three ways of inserting figures [4:32]
- P&L Planning 5/10 How to add a sub account [1:42]
- P&L Planning 6/10 How to build a constant [2:42]
- P&L Planning 7/10 Staff module [2:48]
- P&L Planning 8/10 How to add a staff member [1:33]
- P&L Planning 9/10 How to revise and submit a forecast [3:01]
-
- PMI GoGreen - Cockpit overview [2:49]
- How to create a pre-populated new plan for Budget or Forecast [3:02]
- PMI GoGreen - Water [3:04]
- PMI GoGreen - Missed opportunities [2:57]
- PMI GoGreen - Register actual consumption [2:24]
- PMI GoGreen -Towels & linens [3:02]
- PMI GoGreen - How to prevent food waste [3:03]
- PMI GoGreen - How to reduce energy waste [3:08]
- PMI GoGreen - Waste [3:04]
-
- Articles coming soon
-
-
PMI Release notes
-
- GoGreen Task Bank and Cockpit enhancements - 12.24
- Refrigerants and Fuel Tracking for GoGreen cockpits enhancement - 11.24
- KPI targets enhancement - 10.24
- Automatic renewal of constants enhancement - 10.24
- GoGreen manual entry enhancement - 10.24
- CO2 factors enhancement - 09.24
- KPI targets enhancement - 07.24
- NextGen Rooms Live forecast statistics and pickup data enhancement - 07.24
- Date picker enhancement - 07.24
- Update to NextGen Rooms Live forecast - 06.24
- P&L planning accounts enhancement - 06.24
- Weather normalization enhancement - 05.24
- Update to NextGen Rooms Live forecast page: Sense check updates - 05.24
- PMI adoption index enhancement - 05.24
- PMI adoption index enhancements - April 2024
- Consolidation OTB enhancement - April 2024
- Update to NextGen Rooms live forecast page: Personal view options, Mar 2024
- User administration enhancements March 2024
- GM daily digest enhancement March 2024
- PMI Index calculation updates for 2024
- KPI targets enhancement February 2024
- KPI targets enhancement - January 2024
- Show all articles ( 7 ) Collapse Articles
-
- GoGreen benchmarking enhancement - 01.23
- GoGreen index calculation enhancement - 04.23
- PMI adoption index: Help videos for measurements enhancement - 02.23
- Activity log enhancement - 07.23
- Arrivals and departures forecast enhancement - 02.23
- KPI upload tool enhancement - 08.23
- GoGreen Food waste cockpit enhancement - 08.23
- GoGreen Doing cockpit enhancement - 06.23
- Benchmarking: PMI Index value updates based on time period selected - 06.23
- GoGreen cockpit: Highlight months missing data on 12 month graph - 07.23
- KPI targets enhancement - 01.23
- Goal distribution tool enhancement - 09.23
- Live forecast enhancement: Editing ARR values -12.23
- User administration release note - 12.23
- New page view of Rooms live forecast - 12.23
-
- Benchmarking calculation enhancement - 03.22
- Enhancement to add department type in the P&L report - 03.22
- Print all unmapped accounts on chain level - 03.22
- Printing to Excel and PDF enhancement - 03.22
- Introduction to PMI enhancement
- Room Live forecast – Change to pickup fields - 04.22
- Information/calculation rows in PMI schedule - 09.22
- Export to Google Sheets enhancement - 08.22
- PMI Advanced settings – Period locking - 06.22
- GM daily digest enhancements - 09.22
- PMI adoption index: Option to filter and export scores enhancement - 12.22
- Profit center Live forecast: Automatically switch between OTB and revenue driver
- SMART Forecast enhancement - 09.22
-
Onboarding
-
- Onboarding roles overview
- Onboarding roles – Breakfast
- Onboarding roles – Finance
- Onboarding roles – Food cost
- Onboarding roles – Front Office
- Onboarding roles – Housekeeping
- Onboarding roles – Kitchen
- Onboarding roles – Restaurant and Meeting & Event
- Onboarding roles – Stewarding
- Onboarding roles – Repair and Maintenance
- GM Introduction to PMI
- Onboarding roles – Bar and Pub
- Onboarding roles – Administration
-
-
GM's corner
-
PMI homepage
-
PMI planning
-
- How to work with Rooms Budget and forecast
- How to work with non-rooms Budget and forecast
- Use Forecast/Budget hours from Cockpit in P&L Staff module
- How to input a budget in PMI
- Setting productivity targets in PMI
- Express planner overview
- How to run Express planner
- How to configure Express planner settings
- Express planner calculation explanation with examples
- Compiling revenue streams overview
- How to manually enter a revenue budget in PMI
- How to enter a revenue budget in PMI using Live forecast data
- How to enter a revenue budget in PMI using the Data Upload Centre
- How to set monthly labor productivity and hour targets in PMI
-
- Accounts overview
- How to populate and edit accounts
- How to approve a forecast or budget in PMI
- How to copy from reference
- How to edit and update using the staffing tool
- How to make a profit forecast
- How to set up a weekly Live forecast
- How to add a comparison year in P&L
- How to modify a P&L report
- Planning Menu – Tools and View Options overview
- Planning staff module overview
- How to build a P&L planning report
- How to add staff and manage staff cost
- Staffing screen overview
- How to input a budget in PMI
- PMI Planning module overview
- How to add a Food & beverage revenue forecast in P&L Planning
- How to add room revenue in Planning
- Show all articles ( 3 ) Collapse Articles
-
-
Cockpit
-
- Labor cockpit overview
- Labor Cockpit Preparations
- Labor cockpit cost driver
- SMART forecast explained
- How does SMART allocate daily hours?
- Using arrivals and departures as a cost driver
- Closing Profit Center or Cockpit
- How to work with labor cost
- Min/Max explanation
- Parent and sub-cockpits explained
- Staffing guide explained
- Daily and weekly routines for department heads
- Understanding the importance of including outsourced labor hours in PMI
- How to add labor cost in PMI
-
- Labor cockpit schedule
- How to make a schedule
- How to revise a schedule
- PMI Schedule: Information and Calculation rows explained
- Predefined shift codes
- How to print a schedule
- Revise staff
- Schedule 1/8 Navigation [5:12]
- Schedule 2/8 How to create a labor cockpit schedule [4:29]
- Schedule 3/8 How to add a team member [2:07]
- Schedule 4/8 How to create a shift code [3:30]
- Schedule 5/8 How to add shift codes to team members [3:41]
- Schedule 6/8 How to create a rotating schedule [3:20]
- Schedule 7/8 How to replace shift codes for a period [2:00]
- Schedule 8/8 How to create split shifts between departments [2:42]
- How to work with the Schedule in PMI
- Split Shifts Between Departments
- The Schedule Tools & View menu options overview
- Show all articles ( 3 ) Collapse Articles
-
-
Live forecast
- Live forecast overview
- How to set up a Live forecast: configuration settings
- Live forecast tools and personal view settings
- PMI prediction explained
- Pickup explanation
- Revenue driver explained
- Segment OTB
- Submit Live Forecast to Forecast (monthly routine)
- NextGen Rooms Live forecast overview
- NextGen Rooms Live forecast: Weekly routine overview
- Rooms live forecast: How to work with auto Live forecast
- NextGen Rooms live forecast: Personal view options
- Rooms Live forecast: Sense check mode explained
- How pickup fields are displayed and used in Room live forecast
- Collaborative Forecasting with PMI Prediction
- Non-rooms Live forecast using PMI prediction
- Show all articles ( 1 ) Collapse Articles
-
Data analysis views
-
Administration
-
GoGreen
-
- Comparative data explained
- Data table general explained
- Formula/Calculations explained
- Goal charts and YoY comparison explained
- How to edit a GoGreen plan
- How to set up a Plan
- Intro to NextGen GoGreen Planning
- Main chart explained
- Plan values explained
- Save changes button explained
- Sense check mode explained
- Unit price explained
- Volume/usage/consumption explained
- How to do a monthly forecast routine in NextGen Planning
- GoGreen home page overview
- GoGreen Doing Cockpit overview
- GoGreen Learning page overview
- GoGreen index overview
- Weather normalization overview
- CO2 factors overview
- GoGreen targets explanation
- GoGreen index: How are the measurements calculated?
- Useful links for sustainability and environmental management best practice
- How to make a manual entry in a GoGreen cockpit
- Weather normalization explained
- GoGreen benchmarking enhancement - 01.23
-
-
FAQ
-
- How can I see the hours that are imported to PMI?
- How do I enter the rates?
- How do I know if I am scheduling according to activity?
- How does PMI summarize the hours?
- How is productivity calculated?
- What are fixed hours?
- What are productive and non-productive hours?
- What are the rates and how are they calculated?
- What is a cost driver?
- What is min/max hours?
- Why do the planned hours in the Timekeeping System (TKS) not match PMI?
- Why is the total number of hours for the month too low/high?
- What is SMART?
- How F&B departments can set realistic targets when room revenue drops temporarily
-
- How do I estimate my Closing Inventory?
- My food cost % is wrong (too high/low). Why is that?
- My turnover days are set to 32. What does that mean?
- What are my routines in the Food cost cockpit?
- What do I enter in the Purchase column?
- What is opening and closing stock?
- What is the recommended number of turnover days?
- What is turnover days and how is it calculated?
- Where do I change my food cost forecast?
- Why is opening and closing stock important?
-
- Can one employee work in two departments?
- How do I add a shift code?
- How do I copy hours into the unspecified row (Timekeeping system excluded)
- How do I create a rotating schedule?
- How do I make a new schedule?
- How do I navigate the tools in the schedule?
- What are timekeeping system (TKS) excluded hours for?
- How do I add a schedule to my cockpit?
- Do workers added in the schedule get carried over to future months?
-
- Do I have to change my budget & forecast manually every month?
- How can I see what the current cost driver is?
- How do I set a productivity goal?
- How does the cost driver effect my hours and productivity?
- Where can I find the upload function?
- Why are my budget and forecast locked?
- What is Room revenue planning?
-
- How do I copy to Live forecast?
- How do I submit my Live forecast to forecast?
- How do I reset the pickup for a full month?
- Why do I have a red triangle to the left of the date?
- What are Pickup statistics?
- What are covers?
- What are the seasons in PMI?
- What do the pickups show and why are they sometimes negative?
- What is a revenue driver?
- What is the difference between Forecast and Live forecast?
- Why does on the books in PMI not match what we have in our PMS?
- How do I calculate ARR and ADR?
-
- Can I edit the figures in the Flash report?
- Different view options in the Flash report
- How am I performing compared to my forecast/budget/last year?
- How can I print the report?
- How can I switch between viewing daily and monthly figures?
- How do I check what segments add to the total daily figure?
- How do I edit my covers?
- Why are my room/guest nights wrong?
- What is the Flash Report
- Why is my revenue wrong?
- How is the month-to-date forecast and budget calculated in the Flash report?
- Why are the numbers in the Flash report different from the Live forecast?
- Where can I see account mapping details?
-
- How do I know if the mapping is correct?
- How do I know where accounts should go in PMI?
- How do I map the categories in the timekeeping system (TKS)?
- I cannot see my department in Timekeeping System (TKS) mapping. How do I see it?
- There is a position missing in the Timekeeping system mapping. How can I fix this?
- What are Categories in PMI Timekeeping system?
- What is Departments in Timekeeping system (TKS) mapping?
- What is mapping accounts?
- What is mapping – timekeeping system?
- Why don’t I see the spoon and fork icon in account mapping?
-
KPIs
-
General user knowledge
-
Miscellaneous
-
Access system
- Articles coming soon
-
d2o team only
-
- Articles coming soon
-
- Articles coming soon
-
- Articles coming soon
-
- Articles coming soon
-
-
PMI adoption index

