KPI targets enhancement: Live forecast values for current and future months
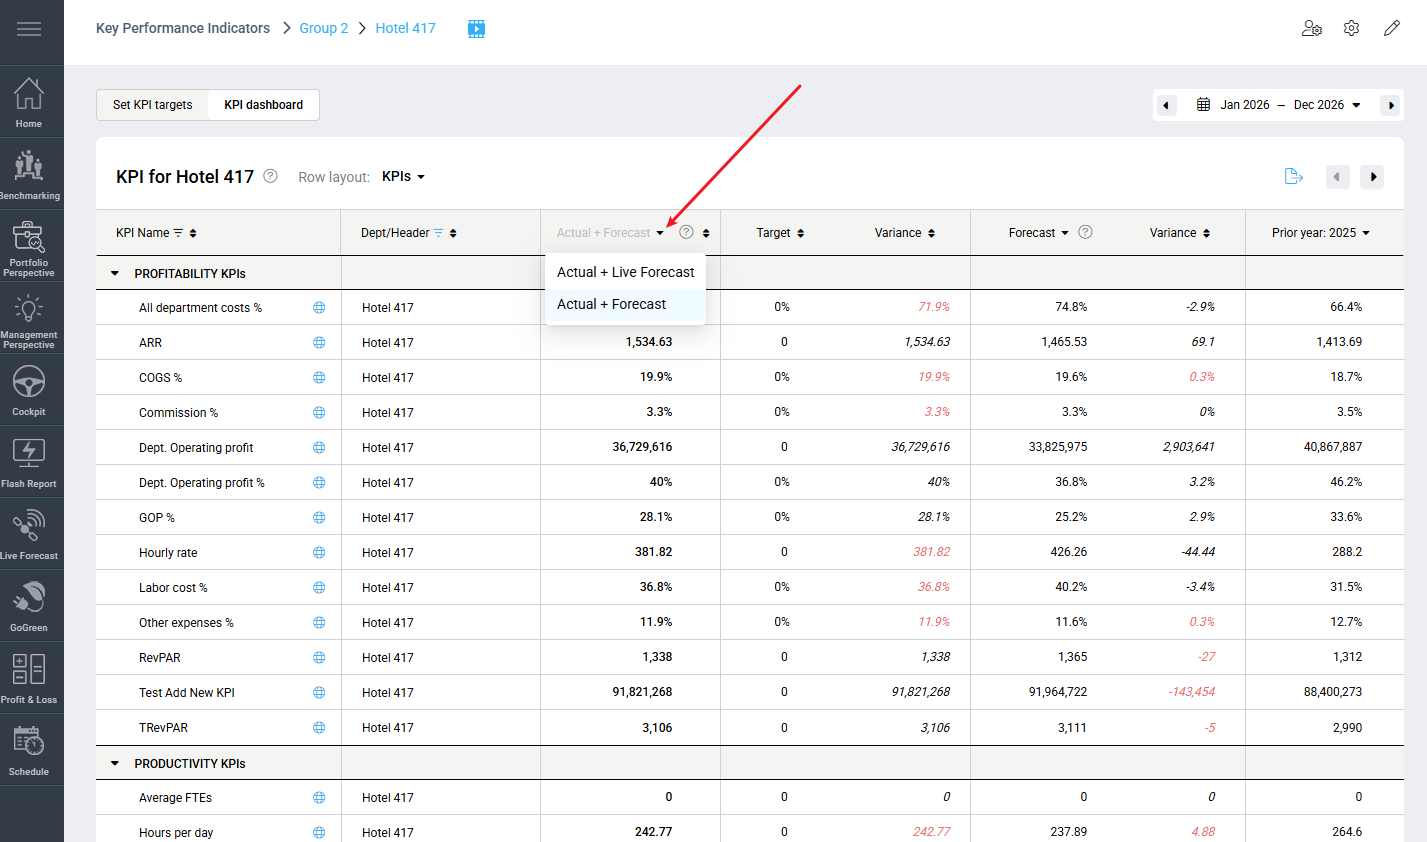
KPI Targets now gives you more flexibility when reviewing current and future performance. Use the new drop-down in the header to switch between the last submitted forecast and the latest live forecast, depending on how you want to analyze your KPIs.
What's new?
A new drop-down has been added to KPI Targets, allowing you to switch between Actual + Forecast and Actual + Live Forecast.
.
What changed?
- A drop-down has been added to the header, allowing you to switch between Actual + Forecast and Actual + Live Forecast.
- Actual + Forecast displays the last submitted forecast for the current and future months.
- Actual + Live Forecast displays the latest live forecast values for the current and future months:
- Financial KPIs use values from P&L.
- Operational KPIs use values from Revenue & Productivity.
- Your last selected display option is remembered and becomes your default view.
- Tooltips and month headers indicate which display option is currently selected.
Why it matters
- Choose the view that best supports your planning and performance reviews.
- Compare your latest live forecast with your submitted forecast.
- Access more up-to-date KPI information throughout the month.
Availability
Available for all properties using the KPI module.
Important: To keep financial KPIs up to date when using Actual + Live Forecast, automated daily P&L Live Forecast updates should be enabled. If you would like to activate this functionality for your property, please contact d2o Support.
Cross reference
Live forecast settings enhancement – Food revenue by segment
What's new
Food revenue can now be configured at segment level within a profit center.
This enhancement allows each segment to have its own food revenue settings and calculation method, providing greater flexibility for operations that forecast Food and Beverage revenue separately.
Why is this useful?
- Configure food revenue independently for each segment.
- Use different food revenue calculation methods for different segments.
- Automatically identify segments that are configured as food segments and lock them at 100% food revenue.
- Improve food revenue forecasting for operations with multiple revenue streams.
- View and manage food revenue percentages directly in Budget & forecast.
What has changed?
Live forecast settings
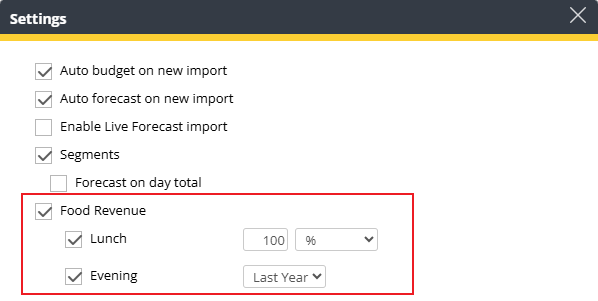
When food revenue is enabled for a segmented profit center:
- Food revenue can be enabled or disabled per segment.
- Each segment can use its own calculation method.
- Food revenue is calculated separately for each segment and combined into a total for the profit center.
- Segments configured as food segments in the property setup are automatically enabled and fixed at 100% food revenue.
Note: During deployment, any existing Food Revenue calculation method configured on the profit center is automatically applied to all segments.

Food revenue settings showing segment-level configuration.
Budget & forecast
Food revenue is now managed using a Food % value.
- Food % is displayed in Budget & forecast.
- Food revenue can be viewed on total level or segment level, depending on forecasting setup.
- Food revenue values are automatically calculated using the configured food revenue settings.
- Food % can be edited when a month is switched to Manual mode.

Image description: Budget & forecast showing the Food % column.
Availability
This is only visible to users with appropriate access rights.
Learn more
For detailed information about configuring food revenue, calculation methods, food segments, and Budget & forecast behavior, see:
Configure food revenue by segment

Updated PIA chat experience
We have released an updated version of PIA Chat designed to make it easier to use alongside your daily work in PMI.
What’s New?
- The Ask PIA button in the top-right corner will be removed. Instead, PIA Chat will be available from the bottom-right corner via the PIA icon.
- The PIA avatar can be freely repositioned, allowing you to place the chat icon wherever it’s most convenient on your screen.
- The PIA Chat window is now detached and can be freely moved around your screen.
- PIA Chat now supports two primary window sizes: Compact (default) and Expanded
- The chat window can also be manually resized to fit your preferred workflow.
- Your chosen window size and position will persist throughout your current session.
- Chat export has been significantly improved, making it easier to save and share conversations.
- The search experience has been updated to provide faster and more responsive results.
What this means for you
This update makes PIA Chat much more practical when following step-by-step guides or working with PMI data. You can now keep the chat window or Knowledge Base content visible while simultaneously interacting with the application, reducing the need to switch back and forth between screens.
Never miss an update
Import status enhancement – Improved interface monitoring and settings
Import status settings in PMI have been improved to provide clearer visibility into interface activity and expected imports.
The update helps users identify missing or delayed imports more easily and improves management of interface settings across properties and chains.
Why is this useful?
- Improve visibility into interface activity
- Detect missing or delayed imports more accurately
- Improve consistency across properties using shared settings on chain level
- Better control of expected arrival times for daily or monthly files
- See all active and inactive interfaces in one list (Chain settings)
What has changed?
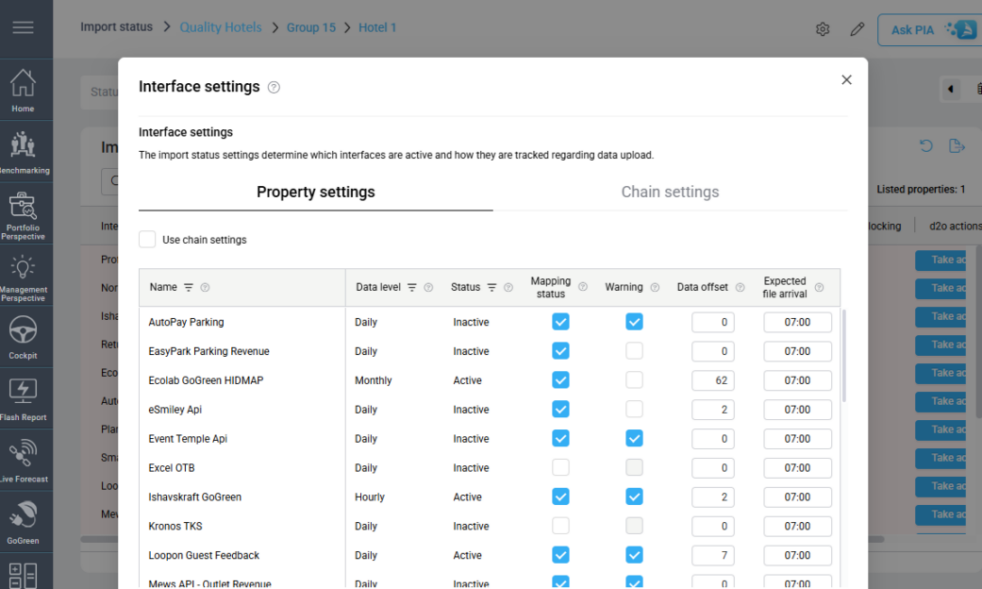
Improved visibility and monitoring
- Added support for Hourly, Daily, and Monthly import monitoring
- Added a new Status column showing whether interfaces are Active or Inactive from SIT
- All interfaces, including inactive interfaces, are now visible in the settings view
- Improved handling of missing imports and imports where PMI data was not updated correctly
Enhanced import timing settings
- Added enhanced Expected file arrival settings with:
- Daily expected arrival times
- Monthly arrival scheduling by day and time
- Added a new Data offset setting to define how many days back or forward data is expected
Improved settings management
- Improved Chain settings synchronization and inheritance logic
- Added new filters and tooltips for easier navigation and visibility
- Removed the legacy “Track status” setting and replaced it with improved logic
- Only users with d2o access can edit settings; other users have view-only access

Image: Some of the improvements indicated in the settings screen
Availability
- Import status settings on both Property and Chain level are view-only for hotel users.
- To request changes or updates to these settings, please contact d2o Support.
Where to find it
- Go to: PMI > Import status > Settings
Good to know
- Property-level settings still override Chain settings where configured
- Monthly interfaces can be configured with a specific expected day and time
- Warning messages are now more closely aligned with expected import timing and data availability
Related articles
Understanding the Import status settings

Profit & loss account, source definition – Account_LY now includes Total option
What's new
In P&L Account → Formula, you can now select a Total option when using the Account_LY source type.
The new Total option appears at sub-category level in the account selection cascade and allows calculations to reference the combined last-year actuals for that sub-category, instead of selecting individual accounts.
This makes it easier to build formulas such as percentage-of-last-year calculations without maintaining separate aggregate accounts.

Image: Accounts_LY with Total as an option
Benefits
- Simplifies last-year based account calculations
- Reduces the need for manual aggregate accounts
- Makes formula setup faster and easier to maintain
Notes
- The Total option is only available for the Account_LY source type
- The current-year Account source type remains unchanged
GM daily digest enhancements
Several enhancements have been added to GM daily digest to improve dashboard configuration for the waterfall chart, revenue visibility, and insight accuracy. Below are more details about the latest updates.
Spa revenue added as a revenue stream
Spa revenue is now available as a separate revenue stream in GM daily digest.

Image: Spa Revenue now added as a new revenue stream
Properties can now:
- Map departments to Spa revenue.
- Display Spa revenue separately in the waterfall chart.
- Include Spa revenue in GM daily digest reporting.
To align reporting across the platform, Spa revenue should also be added to the P&L GM daily digest report configuration where applicable.
Food cost source configuration
Users can now configure which data source should be used for food cost values in the GM daily digest for current and future months.
Available options include:
- Food cost cockpit data
- P&L live forecast data
- Do not include food cost in calculations

Image: Select the appropriate Food cost data source
Improved tooltips
Several dashboard tooltips have been improved to help users better understand where data is coming from and how values are calculated.
Enhancements include:
- Accurate tooltip descriptions
- Revenue tooltips that now show included departments

Image: Select the appropriate Food cost data source
New key insight alerts
GM daily digest now displays additional alerts in Key insights when:
- Expected data has not been updated in PMI
- Accounts are unmapped
- TKS Categories or departments require mapping
The alerts include direct links to the relevant pages to help users resolve issues faster.

Image: Important mapping & data information now visible for the GM
Why this is useful
These enhancements help users:
- Configure which food cost data source should be used for current and future months.
- Keep Spa revenue separate from other revenue streams.
- Gain clearer insight through improved tooltip information.
Cross-references

Mapping – Account: Improvement to mapping a planning account
What's new
The account dropdown in Data source mapping now displays all accounts available for the property, including accounts that have not yet been activated for the selected department.
Accounts that are not yet active are identified with a (*) suffix in the dropdown list.
Users can now select and save these accounts directly from the mapping page. The account is automatically activated for the department during save, removing the need to switch to the Profit and Loss accounts page before completing the mapping.
Benefits
- Reduces setup time when configuring mappings
- Removes unnecessary navigation between modules
- Simplifies onboarding and seasonal account setup
- Keeps mapping workflows faster and more efficient

Image: Select the category when the mapped account is registered

Image: Select account to be mapped. Accounts not mapped are marked with (*)
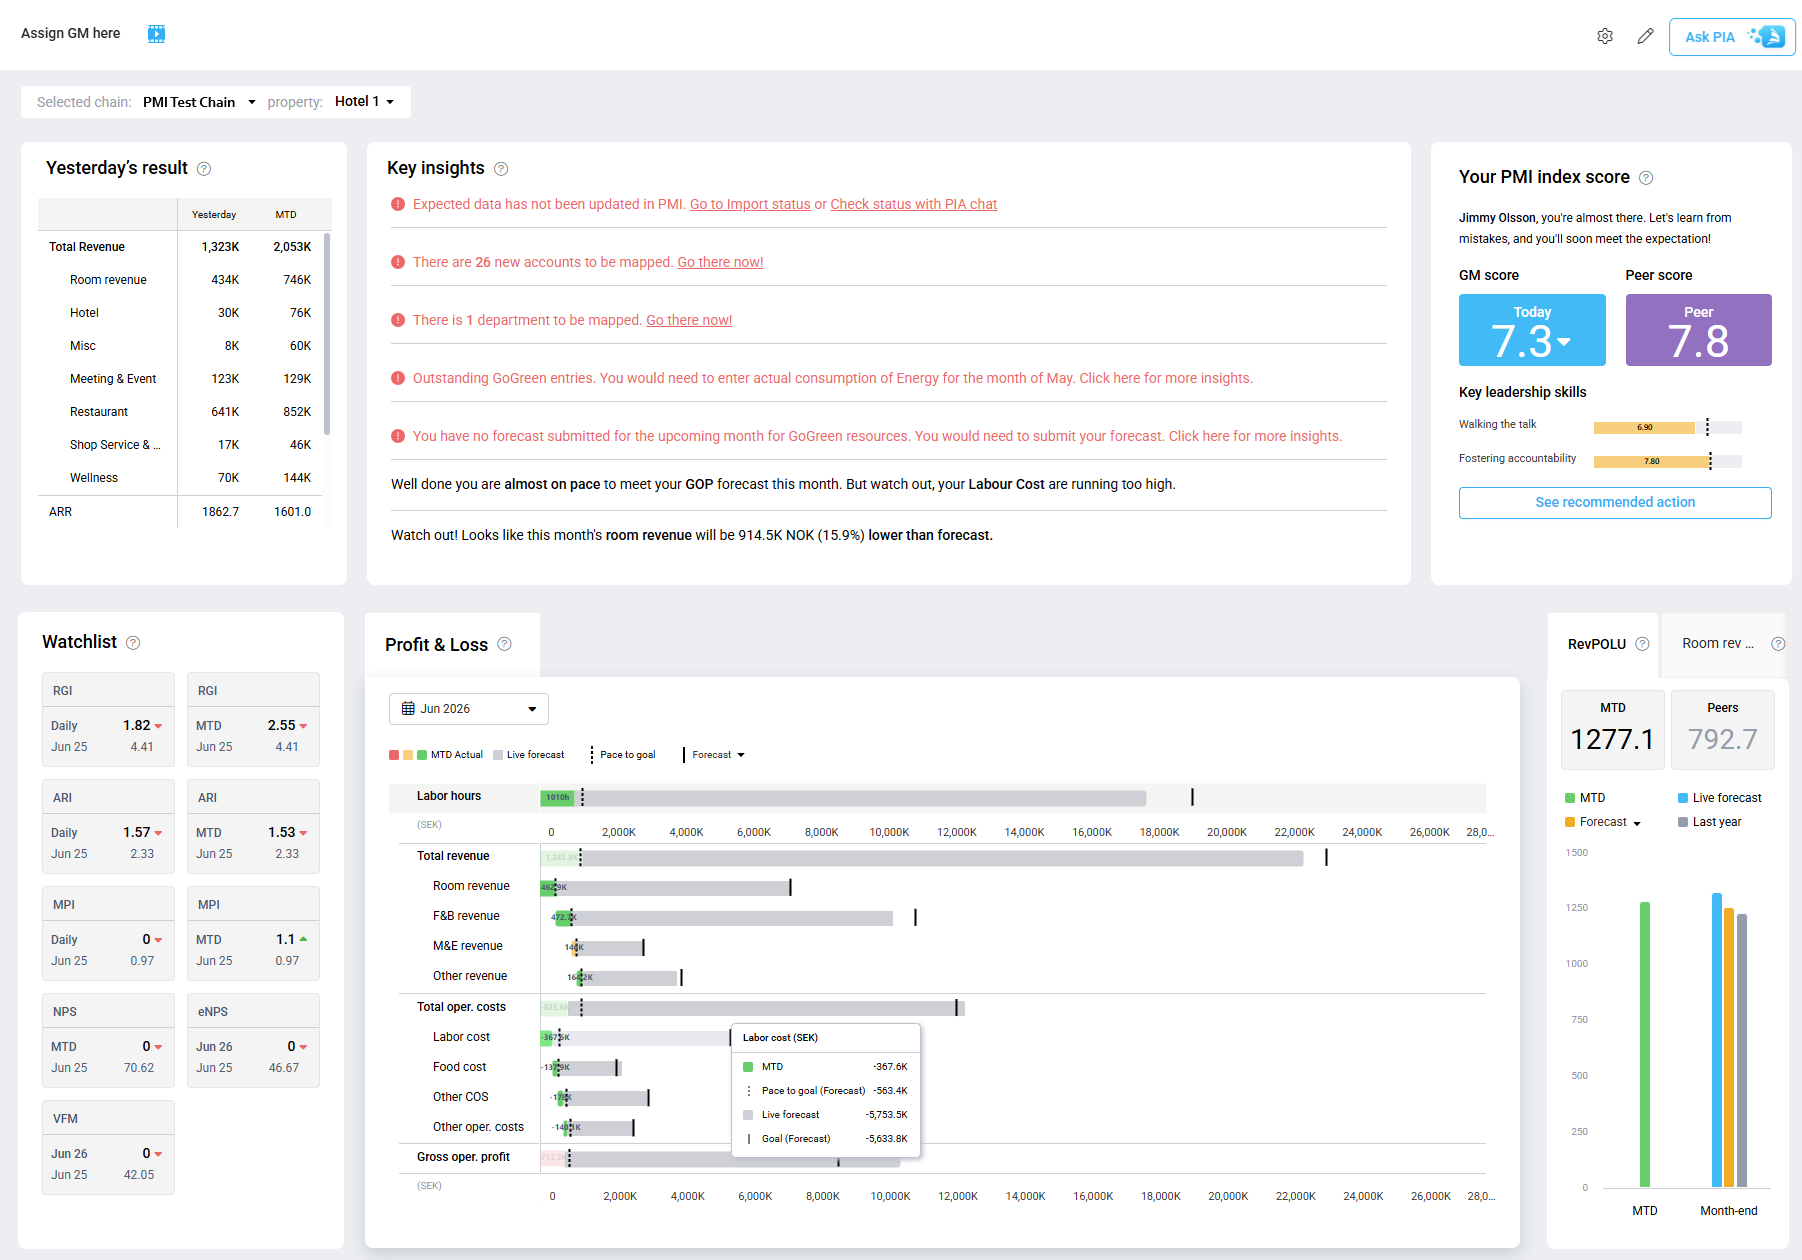
Management perspective enhancements
1. “Today” column added for current month
When viewing the current month, a new column displaying today's Live forecast is displayed next to Yesterday in the Revenue table. The column shows today’s live forecast values, helping users track expected performance for the current day.
Image: Today column displayed next to Yesterday
2. Sticky table headers
The Revenue and Labour cockpit tables now keep their headers visible while scrolling. This makes it easier to review large tables without losing track of the column context.
Image: Table headers remain visible while scrolling
3. Revenue tooltip enhancement
Revenue cells now display the full underlying amount when hovering over a value. This allows compact table values to remain readable while still providing access to the exact number.4. Improved laptop layout
Management perspective now adapts better to smaller and laptop-sized screens by automatically stacking charts above their related tables instead of forcing horizontal scrolling. Larger ultrawide screens continue to use the original side-by-side layout.Live forecast – New behavior in the ARR pickup when changing a date from Auto to Manual
This enhancement is for Room forecasts and profit centres with covers using PMI Prediction and have the pickup calculator enabled in the tools. When a forecast date is changed from Auto to Manual, ARR pickups are now reset to zero to avoid incorrect values being carried over.
Users will also see a warning if units are updated but ARR is left at 0, helping prevent unrealistic forecasts and improving accuracy across room forecasts.
Why is this useful?
- Reduces risk of unrealistic ARR when units are changed manually
- Ensures users are alerted before saving a forecast with ARR = 0
- Improves accuracy and confidence in revenue forecast
What has changed?
- Reset ARR pickups to zero
-
- When switching from Auto → Manual, all pickups for that date are set to 0.
- The live forecast therefore starts from OTB values only, unless manual pickups are entered.
If the setting Use ARR pickup calculator for manual forecasts is disabled, the ARR PMI Prediction values are copied to the live forecast.
- Warning when units are changed but ARR is not
-
- If a user enters manual pickups for units >0 but does not adjust ARR, a warning appears: “You are about to save a live forecast where 0 is used as the average revenue. Do you wish to continue?”
- Options: Yes (save without further warnings for this date) or No (return to the last edited cell).
- Scope: This check applies only when a date is first changed from Auto → Manual.

Image: Warning popup shown when units are entered but ARR remains zero
Forecast types affected
- Room forecast
- Profit centres of type Covers/Units
- Applies at both total level and segment level
Where to find it
Go to: PMI > Live forecast > Change date mode (Auto → Manual)
Good to know
- The updated behavior applies consistently across all PMI Prediction users.
- Once a manual forecast is saved, further edits on that date will not trigger the warning again.
- The change is also implemented in the new UI for rooms.
✅ This enhancement ensures pickup values are not unintentionally inherited and users are warned before saving forecasts with ARR = 0, improving forecast reliability across all profit centers.
KPI Targets – Budget Data and Import/Export Improvements
KPI Targets now support budget data as a comparative and include simplified import/export functionality with more flexible templates, formatting support, and expanded reference options.
What’s New
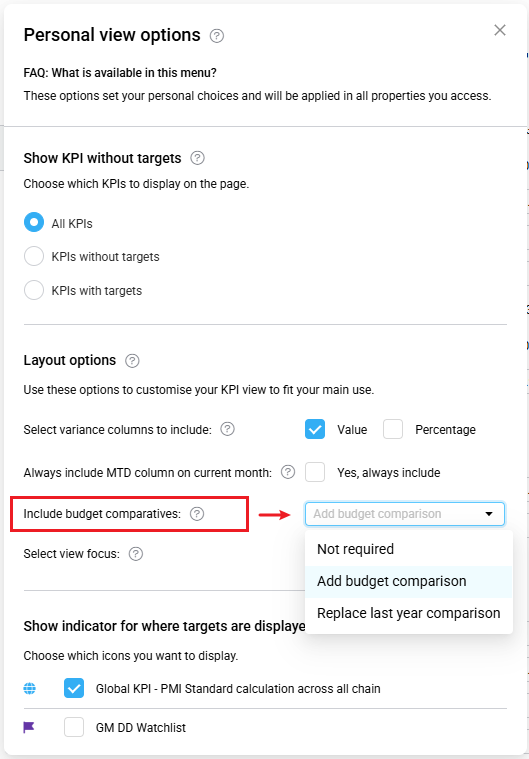
Budget data is now available in the KPI Targets module and can be used when setting KPI targets.
Note: The Budget option is disabled by default and can be enabled for your chain. Contact support@d2o.com for more information.
- Budget can be used as an additional comparison option on dashboard pages via Personal View options.
- The system uses the last submitted budget.
- Revenue and cost are sourced from the P&L using Global Category definitions.
- Hours and Guest Nights/Room Nights are sourced from R&P.
- Budget data is shown as calculated KPI values for the selected period.
- The Set KPI Targets page includes additional reference options that can be copied into targets when a particular data version is a good starting point for target setting.
You can choose between:
-
-
- LTM (Last Twelve Months actuals / rolling actuals)
- The last two calendar years of actual data
- The last two submitted forecasts
- The last submitted budget (if enabled)
-
The copy option uses:
-
-
- Annual averages when viewing the full year
- Monthly values when expanded to monthly view
-

Image: Copy KPI targets from Budget in monthly view
Import/Export Improvements
Several improvements have been made to simplify the KPI target import and export process:
- Exported files from the setup page can now be used directly for import.
- Import is no longer case sensitive and ignores extra spaces in names.
- Property Code can be used instead of Property Name (the system will use the code if valid; otherwise, it will use the name).
- Percentage targets can be entered as 40 or 40%.
- The same template is now used for monthly and annual targets (vertical format).
- Export files can include additional reference information such as cost drivers and hours/productivity to support target setting.
Benefit
These improvements make it easier to set meaningful KPI targets, whether you choose to copy from a budget or forecast dataset that already reflects your expectations for the coming period, or prefer to export a file containing historical performance and department driver information, adjust the targets, and upload the updates in a single bulk import.
We also recommend reviewing the new KPI Display Settings enhancement to remove KPIs that are not relevant for your property before setting targets for the KPIs that are most important to your operational focus.
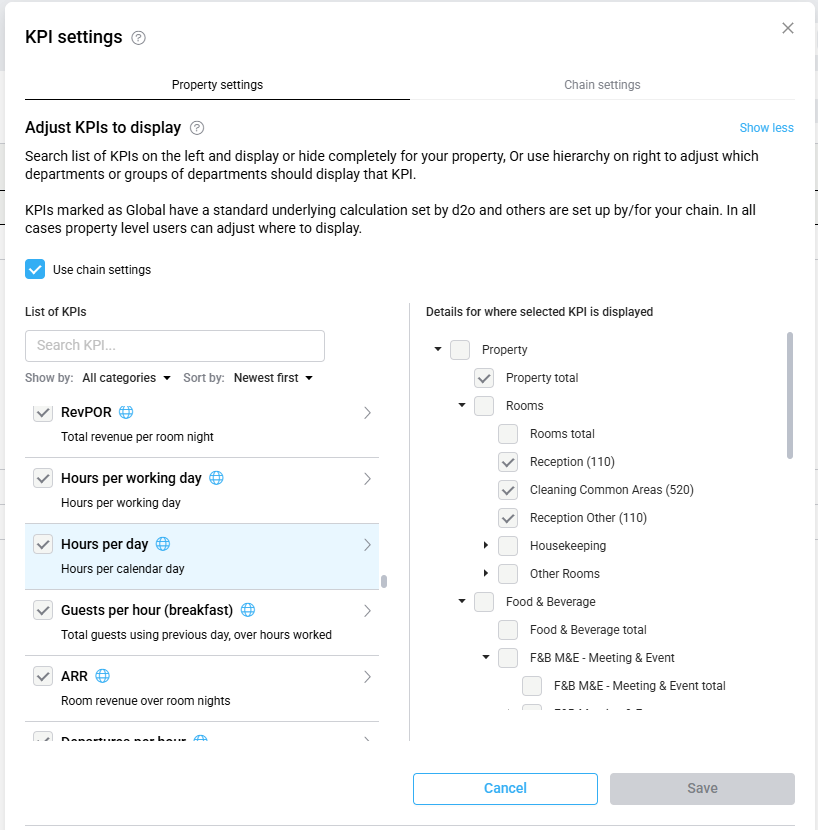
KPI Targets setting – customise KPI view at property level
New KPI setting allow chains and properties to control which KPIs are displayed for departments and groups, reducing unnecessary KPI duplication and improving visibility control.
What’s New
A new setting, Adjust KPIs to display, has been added to KPI Settings.
This enhancement allows chains and properties to control which KPIs are visible for specific departments or groups.
Previously, all properties saw the same KPIs, including KPIs that were not relevant to them.
The original Add KPI option is still used to define and activate new KPIs, including the KPI name, formula, and other setup details.
Once a KPI has been activated by an HQ user, it becomes available in the new Adjust KPIs to display setting, where:
- Chain users can define the default visibility setup.
- Properties can inherit the chain setup or override it where relevant.
Important: Once a KPI has been saved as active, it cannot be deactivated again.
Use of KPIs in other PMI areas, such as the GM DD Watchlist and Cockpit annual chart, still depends on activation in the original KPI setup screen. This ensures that changes made in the display setting do not affect KPI availability in other pages.
Who Can Use This
The following user roles can access KPI settings at property level:
- HQ Controller
- HQ Administrator
- Administrator
The following user roles can access KPI settings at chain level:
- HQ Controller
- HQ Administrator
Improvements
With the new display setting:
- Chains can define which KPIs should be visible as the standard.
- Properties can inherit the chain setting or adjust which KPIs they want to display.
- Global KPIs can be enabled for specific departments or groups without needing to create duplicate KPIs.
- The setting controls KPI visibility only and does not change KPI calculations.
Image: Adjust KPIs to display - Property level using chain settings
Using the display setting
- Select the correct tab to work at either:
-
- Chain level, or
- The current Property level
To make changes at property level, the Use chain settings option must first be de-selected.
-
- Click on ‘Show less’ to expand the view of ‘Adjust KPIs to display’.
- Search for or select a KPI from the list on the left.
- The hierarchy on the right shows where the selected KPI is currently displayed.
- The hierarchy behaves similarly to the PMI filter menu:
-
- You can tick or untick any level.
- Changes will update the dashboard view after saving.
-
Additional Notes
- At Chain level, departments are displayed using generic Department Type names.
For example, enabling Restaurant 1 at chain level will display the property’s specific restaurant name in the Property tab. - Entries ending with “total” indicate that the KPI value is calculated using all departments within that part of the hierarchy, even if individual departments are not displayed.
- If a KPI is unticked in the KPI list on the left, it will not be displayed, even if departments remain selected in the hierarchy on the right.
Benefit
This enhancement gives chains and properties more control over KPI visibility, reduces unnecessary KPIs on property pages, and removes the need to create duplicate KPIs for different departments or groups.

Forecasting after F&B revenue account remapping
If your F&B revenue was previously forecasted into one account (for example account 230) and is later split into several accounts (such as 210 Breakfast, 230 Food, and 110 Beverage/Kiosk), your future Budget & Forecast values must also be updated to follow the new structure.
Historical months are normally left unchanged. The new account structure should instead be applied from a chosen future month onward.
Recommended approach
- Decide the first future month that should use the new account structure.
- Open Budget & Forecast or P&L Planning for the relevant F&B departments.
- Update future revenue forecasts so the totals are distributed into the correct accounts:
* 210 = Breakfast revenue
* 230 = Food revenue
* 110 = Beverage / kiosk revenue - Save the forecast after updating the future months.
- Verify the result in the P&L report by expanding the account level and checking that revenue now flows into the correct accounts.
Important to know
- Historical actuals and previous forecast months may look very different after a remapping change. This is expected.
- PMI automatically redistributes updated monthly forecast totals across the days in the month.
- If your property uses Planning constants/ratios, these can be adjusted so future revenue automatically follows the desired split between the new accounts.
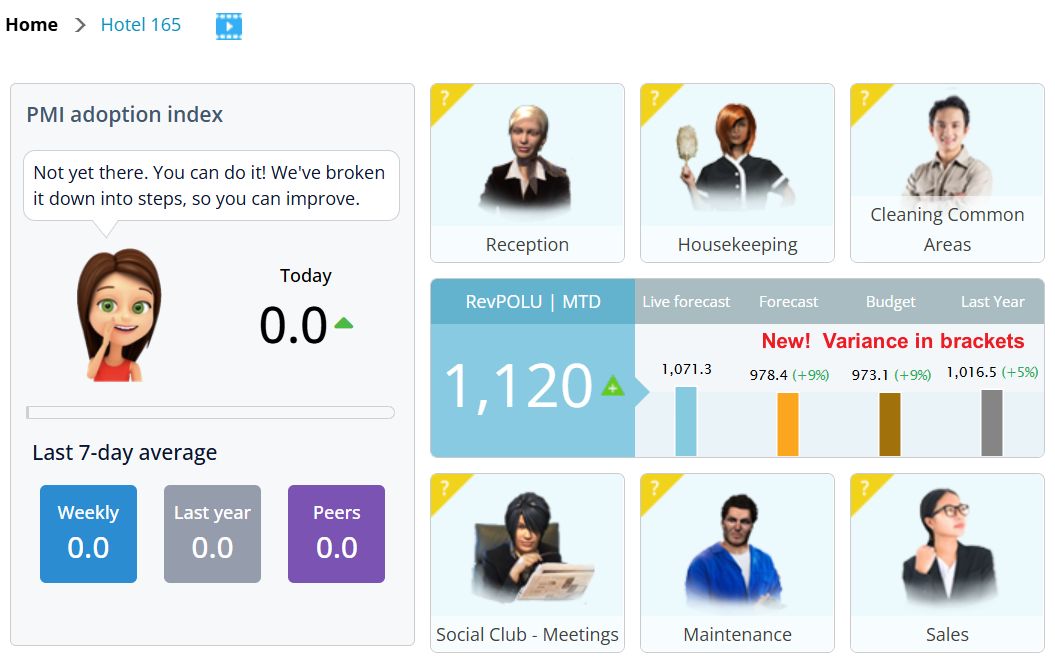
RevPOLU overview now showing variance indicators
The RevPOLU overview column chart now displays variance percentages showing how Actual/Live forecast month-end (current month actual MTD + live forecast) compares to Forecast, Budget/Target, and Last year.
Variances are color-coded to highlight performance — green when Actual/Live forecast outperforms the comparison, and red when it underperforms — with tooltips clarifying each comparison.

Image: Variances (in brackets) vs Actual/live forecast ME

Improved handling of situations where things aren’t working as expected.
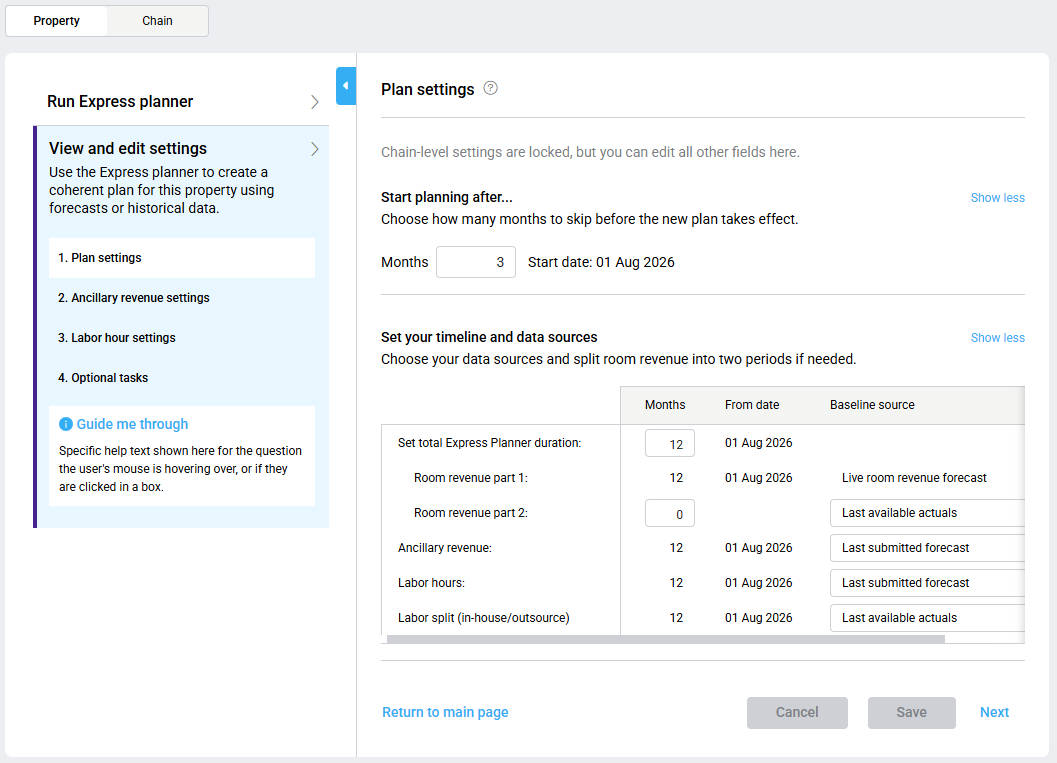
Express planner enhancement – control of overlapping periods
Express planner now gives you more control over how labor hours are handled when the Express planner planning period overlaps with existing staff schedules. This enhancement helps ensure labor plans align with your hotel’s preferred planning and scheduling process.
At a glance
New key features of the enhancement:
- Choose how labor hours are handled for overlapping periods
- Decide whether Express planner recalculates hours, uses scheduled hours, or keeps existing values
- Improve alignment between planning and operational schedules
What has changed
When the Express planner planning period overlaps with the schedule horizon in cockpits, you can now decide how labor hours for the overlapping period are treated.
The following options are available in labor hour settings:
- Use express planner calculation
Express planner recalculates labor hours for the overlapping period using the selected baseline and productivity logic.
- Use hours found in the schedules
Express planner uses the hours already planned in staff schedules.
- Don't update hours
Express planner keeps the existing hours for the overlapping period and does not make any changes.
Previously, labor hours for overlapping periods were not updated. This enhancement provides flexibility to either update or preserve data, depending on how you manage your planning process.
Who can use it
Available for properties with Express planner enabled.
This change does not affect existing data unless Express planner is run again.
Access to the setting depends on user rights and chain-level configuration. Some settings may be locked at chain level.
You can find this setting under Express planner settings → labor hours settings.
Cross-reference:
For an overview of Express Planner, please see Express planner overview and How to configure Express planner settings.
Reference column not included when exporting Account Summary to Excel
When exporting the Account Summary to Excel, the Reference column is not included, even if it is visible on screen.
This is because the Reference column is a view-only comparison column, and the export only includes the primary data columns (such as Actual, Budget, and Forecast).
This is the current design of Account Summary export, not something that can be enabled via settings.
Workaround
If you need the reference values in Excel:
- Go to Planning → Profit & Loss (P&L Report)
- Add your reference version (e.g. last year or another forecast) as a column
- Export the report to Excel
This will give you both your main data and the comparison values in the same export.
Monthly Forecast changes vs daily distribution
Why can’t I create a consolidated view in Management Perspective?
To create a consolidated view in Management Perspective, there are two important prerequisites:
In Benchmarking, the Tools → Setup sources option is only available when you are in Productivity view. If you are in another Benchmarking view, you will not see it.
Also, Consolidated views must be activated as a module in the Hierarchy. If the Consolidated views option is missing under Advanced settings, this usually means the module is not enabled for your environment. In that case, someone from d2o needs to activate it.
Once both are in place, you can create the productivity department in Benchmarking, exclude A&G, and then make it available as a consolidated view in Management Perspective.
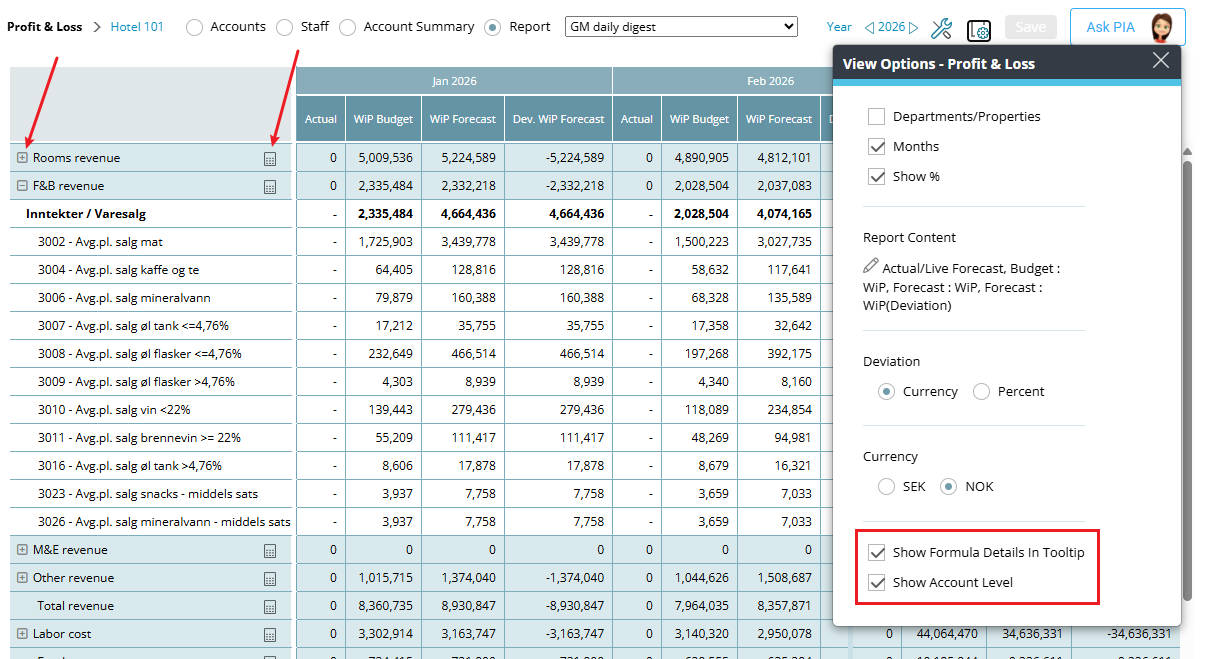
Profit & loss reports – View calculations and drill into values
You can now understand how values in your P&L reports are built up directly from planning report view. This will let you view calculations and explore the data behind each line item without navigating away.
What’s new
Two new view settings are available in P&L reports:
Show formula details in tooltip
- A calculator icon (🖩) appears next to value rows in standard P&L reports
- Hovering over the icon shows a tooltip with a quick overview of the calculation
- Clicking the icon automatically:
- opens the reports panel
- scrolls to the selected item
- expands the full calculation

Image: New View options with Calculator icon in the report
Show account level
- You can also expand report rows (+) to:
- view underlying accounts contributing to the value
- see how totals are built up across departments, hotels, or other dimensions
Note: This functionality is not available in group views.

Image: Expand button to see accounts details
Benefit
Quickly understand where numbers come from—whether reviewing formulas or validating underlying data—without switching to other views like Accounts or Account Summary
Cross-reference:
For more details regarding this enhancement see How to modify a P&L report
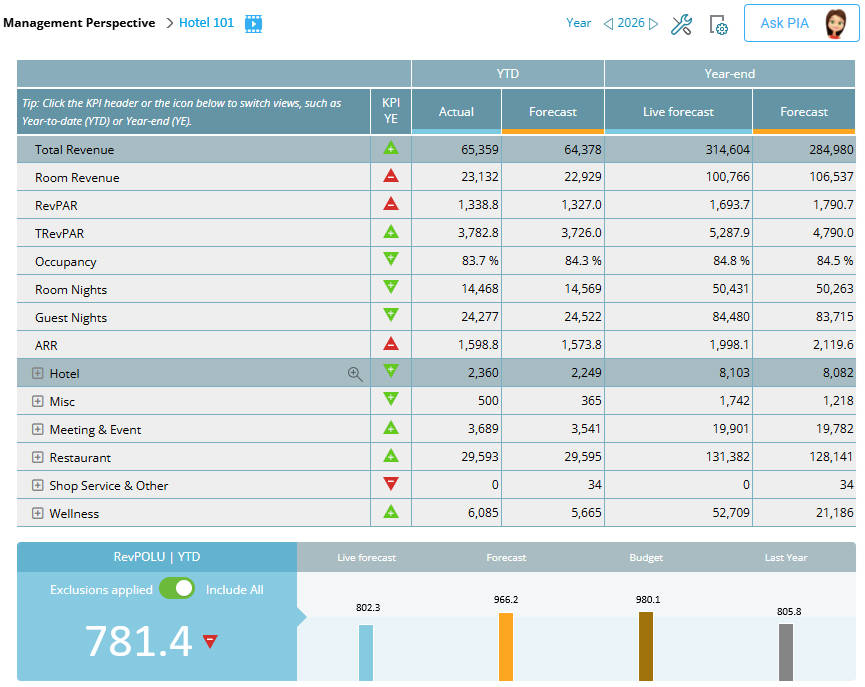
Management Perspective: RevPOLU toggle to include or exclude departments
A new toggle has been added to the RevPOLU panel in Management Perspective, allowing you to view productivity with or without excluded departments.
What's new
You can now switch between two modes:
- Exclusions applied– excludes departments marked “Exclude from RevPOLU” (current behavior)
- Include all – includes all departments in the calculation
This makes it easier to compare productivity figures and understand the full operational picture.

Image: RevPOLU panel with the toggle visible above the main KPI
Excel export
Exports from Management Perspective reflect the currently selected mode, ensuring consistency between on-screen data and exported results.
Benefit
Quickly compare productivity with and without excluded departments to see the full impact on performance.
Important information
- The toggle is only visible if one or more departments are using the “Exclude from RevPOLU” setting
- Standard mode remains unchanged and matches previous behaviour
- Departments marked “Exclude from RevPOLU” are only included when Include all is selected
- Hover over each mode to see a tooltip describing its meaning
Cross-reference:
Period locking – extended control for GoGreen imports
Period locking has been enhanced to give you more control over GoGreen actual data. You can now prevent imports from updating locked periods, and better understand how locks impact your data and workflows.
What’s new
Extended lock option (GoGreen – imports only)
- You can now apply extended locking to selected GoGreen resources
- When enabled, imports will not update locked periods
- Configured at chain level in Settings
Clear visibility of extended locks
- A new icon indicates which resources have extended locking enabled
- Hovering over the icon shows: “Lock blocks imports and manual entries”

Image: Extended lock settings & icons in the Period locking table
Stronger control of chain-level locks
- Once a chain-level period is locked, it cannot be unlocked again
- Changes after locking must be handled via property exceptions
Import status: Imroved handling of imported data
- New status: Partial update when some data is blocked by period locking
- New message: Period locking restriction explains why data was not imported
- Data for unlocked periods is still imported, while locked data is skipped
- A new column shows when period locking affects an import
- You can open the relevant period locking view directly from the import
- When a period is reopened, previously blocked data is automatically processed
Additional safeguards in mapping
- Mapping changes are blocked if relevant periods are locked
- Clear warning messages explain which periods must be opened before saving
- Helps prevent unintended data changes
Benefit
These enhancements give you stricter control over GoGreen data integrity while improving transparency:
- Prevent unintended updates from imports to locked periods
- Improve transparency of how locks affect incoming data
- Reduce risk when working with historical data and mappings
- Support stricter control where data is managed externally
Important information
- Chain-level locks cannot be reopened once active; use property exceptions if needed
- Reopening a period may trigger previously blocked imports to be processed
Cross-references
For more information, see:
Why is Productivity Target MTD different from Month-End?
Short answer:
They use the same monthly target, but MTD is recalculated using SMART-distributed hours and cost driver for the days elapsed. Because SMART is not evenly distributed, the values will differ.
Explanation
- Month-End target
- Based on the full-month plan
- Uses total monthly hours and cost driver
→ Represents the overall monthly goal - MTD target
- Based on SMART-distributed hours up to today
- Uses the cost driver for the same period
→ Represents the expected productivity for the elapsed days
Key point
MTD is not a proportional slice of the monthly target.
It is recalculated using SMART distribution, which varies by day.
Result
Because staffing and demand fluctuate across the month:
- MTD target ≠ Month-End target
- The difference is expected and reflects real operational patterns

GoGreen Planning process streamlined for review and submit monthly forecasts
The GoGreen planning module has been updated with both a refresh of the page look and feel, and an update to the monthly routine. Costs are linked to consumption for more accurate calculations. Submitting GoGreen costs monthly is now integrated into the property monthly forecast process, removing the need for additional setup steps.

Image: New look and feel for GoGreen planning module
What's new
- The GoGreen forecast cost is linked to Profit & loss and included automatically as part of the standard monthly forecast submission. Properties without Planning module have a new automated process for GoGreen data.
- Update to the UI of the GoGreen planning page including new charts and more flexiblie edit functionality.
- GoGreen monthly forecast data has a Live forecast version with daily updates of consumption and guest nights.
- Update to the Unit price calculation logic using historical costs as a starting point.
- You can review the forecast at any point before the standard monthly forecast process.
- Chain and property settings and configuration moved to Planning setup page
- Change of access to GoGreen planning page: not through Planning setup but directly from Budget/Target & forecast module or linked from Profit & loss GoGreen accounts
Important note: as part of the release of the new UI, submitted GoGreen forecasts or budgets from 2025 and the start of 2026 will be migrated so that they can be still viewed in the new GoGreen planning page. As a result, they may also appear in the list of versions in the Status tool in Profit & Loss module. These are not financial forecasts and so cannot be rejected or approved; they will not affect other financial forecasts.
Why it's useful
- No additional steps required for creating and submitting the GoGreen data – they are included automatically when property monthly forecast is submitted.
- Consumption and cost are better connected ensuring more accuracy on the cost forecast.
- Live forecast uses current PMI predictions and past actuals for a more consistent and reliable calculations of costs, but new edit functionality allows flexibility where this is required.
Availability
- Planning setup: Administrator and Controller roles (edit property; HQ to edit chain).
- GoGreen planning edit: Department manager or higher with GoGreen User role; Controller or higher
- GoGreen planning view-only: All other main roles without GoGreen User role
Learn more
To understand how this works and how to use it, see the following articles:
Last updated timestamp now in Benchmarking, Portfolio perspective and KPI targets
Where you will see this
1. Portfolio Perspective
When hovering over any indicator or value in the columns, a tooltip will display the date and time when that specific data was last updated in the Portfolio Perspective.
Image: Portfolio perspective tooltip with last updated information
2. Benchmarking
A new line has been added to the top left corner of the table showing the last updated timestamp for the data in the entire table.
Image: Benchmarking with last updated information
3. KPI Targets
In KPI Targets,Last updated tooltips are now available for values in:- Actuals column (period date)
- Forecast column
- Prior Year column

Image: KPI targets tooltip with last updated information per individual KPI
Benefit
Helps you understand when data was last updated and why numbers may differ between modules. Data in PMI may update at different times across modules. These tooltips help you see when data was last updated and understand why numbers may differ.Live Forecast – Improvements and new settings in Tools
Several improvements and new tools were recently added to Live forecast to improve prediction handling and forecast reset functionality.
1. Update Live forecast to PMI prediction when changing from manual to auto
This improvement applies to:
- All Rooms Live Forecast departments
- Non-Rooms departments with the PMI prediction module activated
When a day is changed from manual back to auto (robot icon), PMI will now discard the manual edits and immediately update the day with the PMI prediction value after save and refresh.
Previously, the PMI prediction value was only updated after the next data import (typically the next day).
Benefit: Users can immediately return a day to the predicted value without waiting for the next import.
2. Reset live forecast (non-rooms departments)
The Reset live forecast option in Tools replaces the previous Reset pickup option for non-rooms departments using PMI prediction.
This option:
- Resets the live forecast to the PMI prediction
- Removes manual edits
- Updates all days in the selected period in one action
This means users can restore the prediction values for a full month (or selected period) at once, instead of changing each day from manual to auto individually.
Benefit: Faster way to restore prediction values for an entire period.
3. Reset pickup all (Rooms Live forecast)
A new option in Tools → Reset pickup all has been added to Rooms Live forecast.
'Reset Pickup All' resets pickups for the current month and all future months.
This option was added in addition to the existing 'Reset Pickup' where users could only reset pickups for the current month.
Benefit: Faster reset when reforecasting or after major changes in demand.
Note: This option is only available when PMI Prediction is fully automated. If the forecast is imported or partially imported, the Live Forecast equals OTB and pickups cannot be reset.
Cross reference
Copy Forecast into Budget – What to Use
If you want to copy your forecast into your budget in PMI, the correct method depends on where and how your setup is configured.
Which method should I use?
- Planning (P&L): Use Copy From Reference
- Budget & Forecast (simple revenue setup): Use Copy (Submit)
- R&P or template-based setup: Use Upload Centre
Rooms & F&B (simple Budget & Forecast setup)
If you are working with revenue (Rooms, F&B, or other departments) and your setup allows it, you can use:
Copy (Submit) several
- Go to Live Forecast
- Open the Tools menu
- Select Copy (Submit) several
- Choose to copy from Live Forecast → Budget
- Select period and version, then confirm
This copies your operational forecast into the Budget version.
R&P / Upload-based workflow
If you are working in an R&P setup or using upload templates, you cannot copy directly inside PMI.
Instead, you must use the Upload Centre:
- Go to Administration → Data Upload Centre
- Download the Forecast for the desired period
- Download a Budget upload template for the same period
- Copy values (only values) from the Forecast file into the Budget file
- Upload the Budget template back into PMI
Important: The Budget period must be unlocked in Period locking, otherwise the upload will fail.
Profit & Loss (Planning module)
If you are working with the full financial P&L, use:
Copy From Reference
- Go to Planning → Profit & Loss
- Open Tools
- Select Copy From Reference
- Choose source version (e.g. Forecast) and target (e.g. Budget)
Common confusion
These are different workflows depending on your setup:
- Budget & Forecast: Operational revenue (Rooms, F&B)
- R&P: Often requires upload templates instead of direct copy
- Planning: Full financial P&L
If you are unsure which setup you are using, check if you have access to the Upload Centre or contact your administrator.
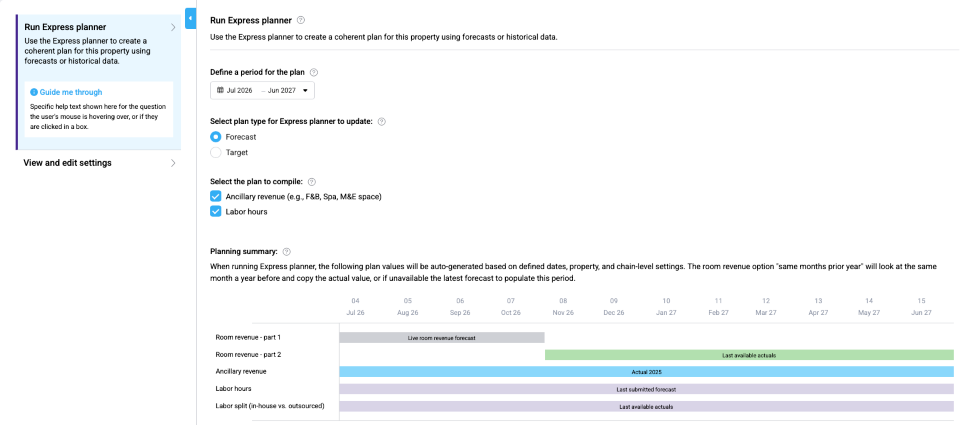
Express planner enhancement – Separate data source for in-house and outsourced labor split
Express planner now enables more accurate labor planning by allowing you to define a separate data source for splitting in-house and outsourced hours. This ensures the labor distribution better reflects your actual staffing structure, while continuing to automate revenue and labor planning.
At a glance
New key features of the enhancement:
- Define a dedicated source for splitting labor hours into in-house and outsourced
- Improve labor planning accuracy by aligning the split with relevant historical or forecast data
- Available source options include: Last available actuals, Same as total labor hours, or No split
What has changed
You can now select a separate baseline or data source specifically for how labor hours are split between in-house and outsourced staffing. Previously, the split used the same source as the total labor hours. With this enhancement, the split can be based on a different and more relevant dataset, allowing for more accurate representation of staffing structures.
Who can use it
Available for properties with Express planner enabled and configured to use both in-house and outsourced labor hours.
For an overview of Express Planner, please see Express planner overview article.
What should I do when I see “Show me how” in the GoGreen Index score?
The Index score shows how well the resource is being managed based on GoGreen best-practice measurements.
Click “Show me how” to open the GoGreen Index, where you can see what is impacting your score and what to prioritize.
Start by focusing on the lowest-scoring or highest-impact items. Typically, this means:
- Ensuring recent consumption has been entered
- Checking that the Live forecast aligns with target
- Reviewing and completing relevant tasks
👉 The score itself is only an indicator, the Index page shows the specific actions to take.
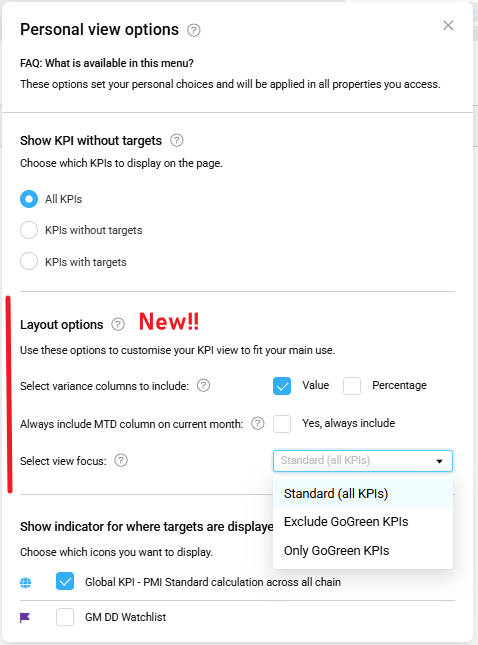
KPI Targets – New layout options in Personal view settings
A new Layout options section has been added to Personal view options, allowing you to customise how KPI data is displayed. Your preferences apply automatically across all properties you can access.
Why this matters
You can choose how KPI variance is displayed, automatically include the Month-to-Date column, and start with the KPI view most relevant to your role.
What’s new
A new Layout options section has been added with three settings:
- Variance columns
Choose which variance columns appear in the KPI view:
-
- Value (numerical variance)
- Percentage (percentage variance)
- Always include Month-to-Date (MTD)
Preset whether the MTD column is automatically shown when viewing the current month.
- View focus
Set a default KPI focus, for example:
-
- Standard (all KPIs)
- A focused view such as Go Green KPIs
Your preferred view is applied automatically when opening the KPI page, but can still be changed at any time.
Who can use it
Available to users with access to the KPI Targets module.

Image: New Layout in Personal view option
Resize the PIA chat window to fit your screen
We’ve improved the PIA chat window with a new resize handle, giving you more control over how much space the chat uses on your screen. A visible resize handle is now always available on the edge of the chat window.
You can now:
- Drag the handle to make the chat window wider or narrower
- Adjust the size to better view longer responses and content
Default width
- The chat opens at the standard default width.
- The window cannot be resized smaller than this size to ensure usability.
Quick reset
- Double-click the resize handle to instantly restore the chat window to its default width.
This improvement makes it easier to read longer responses, review lists or release notes, and adjust the chat layout to better fit your workflow.

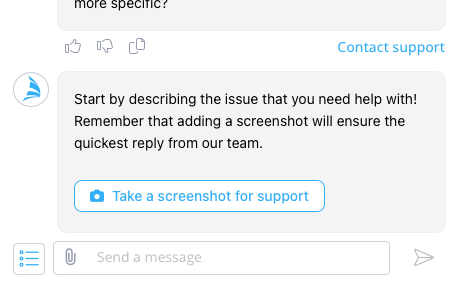
Contact Support from Chat
We’ve added a new Contact Support feature to make it easier to get help when you need it.
How it works
You can now start the support process in two ways:
- Type “contact support” in chat to automatically trigger the support flow.
- Click the “Contact support” link located under any response.
Once initiated, the support flow will guide you through a few quick steps:
- Describe your issue so our team understands what’s happening.
- Add a screenshot (recommended) to help us diagnose and resolve the issue faster.
- PIA will first attempt to assist you and suggest a solution.
- If the issue is not resolved, you will be directed to the human support team for further assistance.
Resolution Paths
The support flow can end in one of two ways:
✅ Problem Resolved
If the issue is resolved during the process, the conversation will be marked as resolved and logged with support.
❗ Still Need Help
If the issue is not resolved, a support form popup will appear so you can provide additional details.
A ticket will then be created in the d2o Support system for follow-up by our support team that will respond as soon as possible.
What gets sent to Support
Both outcomes are tracked by support:
- Resolved issues
- Unresolved issues that generate support tickets
This helps us improve the system and respond faster to future problems.

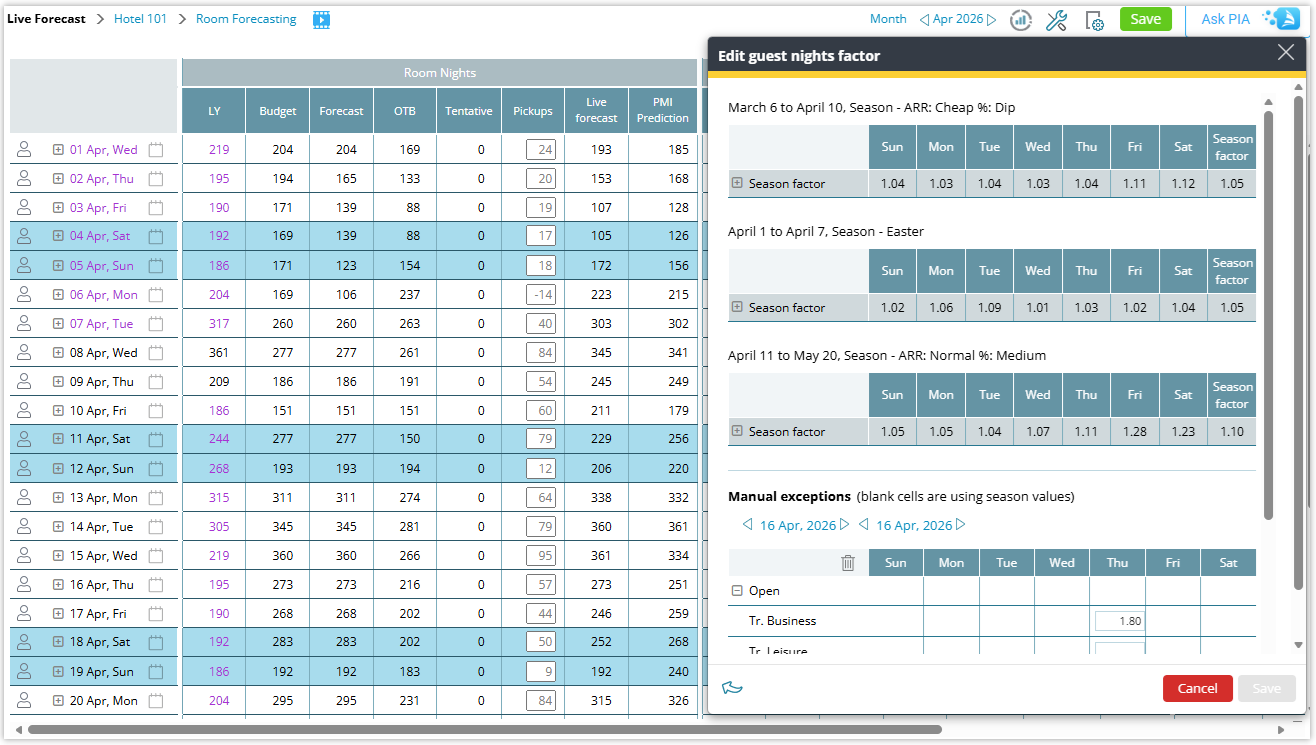
Rooms Live forecast – Guest nights factor improvements
Edit Guest nights factors Improvement
Guest nights factors are now managed in a single tool, ensuring consistent guest calculations across Live forecast, Budget & Forecast, and Revise forecast.
Introduction
The Guest nights factor logic in Live forecast has been redesigned to remove inconsistencies, eliminate conflicting editing paths, and provide a clearer link between room nights and guest nights. The updated structure ensures that guest night calculations remain aligned with seasons, weekday patterns, and manual exceptions.
What has changed
Guest nights factors follow seasons by default
Season-based weekday factors are automatically applied for all properties, with a clear display of the seasons covering the selected period.
Direct editing removed from Live forecast
Guest night values can no longer be edited directly. Users are guided to the Guest nights factor tool to manage changes.
Updated Guest nights factor tool
The tool clearly displays the seasons that apply to the selected period together with any manual exceptions. Historical periods are displayed as read-only.
Manual exceptions improved
Manual overrides are now managed entirely within the Guest nights factor tool and always take priority over seasonal values.
Budget & Forecast alignment
Guest nights are no longer editable in Budget & Forecast. Monthly guest nights always follow the guest nights factors defined in Live forecast.
Revise forecast alignment
Revise forecast now uses the same factor logic as Budget & Forecast, ensuring guest nights remain consistent with room nights and saved Guest nights factors.
Copy to Live forecast improvement
Copying room nights now automatically copies guest nights.
Updated tooltips
Tooltips clarify how On the Books (OTB), pickup and Live forecast guest nights are derived.
Guest nights view fully calculated
Guest nights are now fully calculated values. Pickup guest nights are derived from room nights pickup multiplied by the Guest nights factor, resulting in an automated guest nights ratio.
Good to know
- Default for all future months is always based on season.
- During implementation, previously defined non-season values are converted into manual exceptions.
- Guest nights are always calculated from room nights.
- Editing room forecast will update guest forecast automatically.
- Guest view is now fully calculation-driven.
Why this matters
These improvements provide a single source of truth for Guest nights factors, prevent calculation conflicts, and ensure more reliable guest forecasts across PMI forecasting modules.
Related articles
Rooms Live forecast – Guest nights factor explained
Live forecast settings – Copy to live forecast
Live forecast settings – Revise forecast/budget
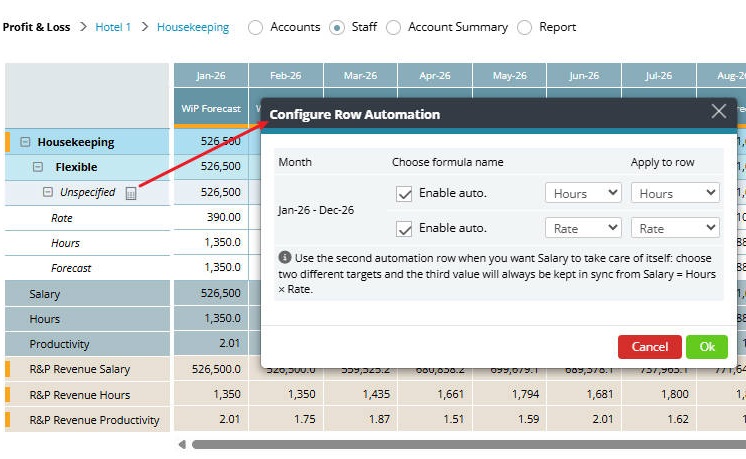
P&L Staff – Automatically populate hours and rates from Budget & forecast
Hours and rates maintained in Budget & Forecast can now automatically populate the Staff view in Profit & Loss.
Once configured, the Hours and Rate rows in the Staff module are automatically populated, ensuring staffing data in Profit & Loss reflects the latest budget and forecast labor values.
What has changed
You can now configure the P&L Staff module to automatically populate budgeted and forecasted hours and rates from the Budget & forecast module.
This removes the need to manually update staff hours and rates in the Staff module when values change in Budget & Forecast.
Who can use it
Users with Salary editor rights for the relevant department.
Why this is useful
- Reduces manual data entry in both Staff module and Budget & forecast module.
- Ensures labor costs stay aligned with Budget & Forecast
Learn more:
For more information, go to: Auto-populate P&L Staff hours and rates from Budget & forecast
How to change available rooms in PMI

If you need to change the number of available rooms in PMI, do it in Live Forecast.
How to do it
- Open Live Forecast
- Go to Tools
- Select Available Rooms
- Enter the updated number of rooms for the relevant dates
- Save
Use this when rooms are temporarily unavailable, for example during renovation, out-of-order periods, or temporary closure.
KPI Targets – usability and filtering improvements
The KPI Targets page now includes several usability improvements that make it easier to navigate KPI structures and manage filters across properties and departments.
Note: As part of this update, the page layout and filtering experience have been improved. Some elements may appear slightly different from earlier versions.
At a glance
This update includes:
- Improved page header and navigation
- Excel-style column filtering
- Warning banner for missing department mappings
- Smarter defaults when opening a new KPI target year
Who can use it
This enhancement is available to chains where the KPI Targets module is activated.
If your organization is interested in using KPI Targets, please contact support@d2o.com for more information.
What has changed
- Cleaner page header and filters
- The page header has been simplified and the breadcrumb now clearly shows whether you are viewing Group / All Properties or Group / Property.
- Warning banner for missing department mappings
- A warning banner now alerts users if departments are not mapped in the alternative hierarchy.
- Smarter KPI defaults
- When opening a new year with no KPI targets defined, PMI will now automatically display all KPIs to prevent blank screens.
- Improved hierarchy filtering
- The department/header column now supports full filtering, making it easier to navigate large KPI structures.
- Upgraded column filters
- Column filters have been modernized with an Excel-like filtering experience. Additional improvements include:
- “Total” rows to separate group KPIs from hierarchy selections
- Improved logic in the Restricted column to clarify available choices
- Column filters have been modernized with an Excel-like filtering experience. Additional improvements include:
Why this is useful
These improvements make the KPI Targets page easier to navigate and manage, especially for users working with many KPIs across multiple departments or properties.
Learn more
To understand how the filters work, see Filtering data in PMI tables
Why are some numbers purple, blue, red or orange (amber) in the Live Forecast?
Live Forecast Color Legend (forecast table)
Note: This color legend applies only to the values shown in the Live Forecast table. Other views in PMI, such as Sense Check or alert panels, may use similar colors with different meanings.
Colors in the Live Forecast table help you quickly understand how a forecast value was created and whether it requires attention.
These colors apply to the values shown directly in the Live Forecast table and are not related to alert highlights used in other views (such as Sense Check).
Purple
Values shown in purple have been manually edited or overridden by a user.
This means the number differs from the system-generated forecast.
Blue
Blue numbers indicate that the forecast is constrained by capacity.
The system prediction may be higher, but the value is limited by the configured maximum available rooms or capacity.
Red
Red values appear when a saved value exceeds the defined capacity.
This warns that the number is higher than the available room inventory.
Orange / Amber (sometimes perceived as yellow)
Orange/amber values in the Live Forecast table indicate data quality, not capacity warnings.
Orange (amber) numbers mean that PMI does not have enough data to generate a reliable automatic forecast.
This can happen when:
- historical data is limited
- booking patterns are unclear
- data imports are missing
- the date is far in the future
When you see this color, the day should typically be reviewed and forecast manually.
Tip: If many days appear in orange, check that your data imports and historical data are complete, as missing or incomplete data can affect forecast accuracy.
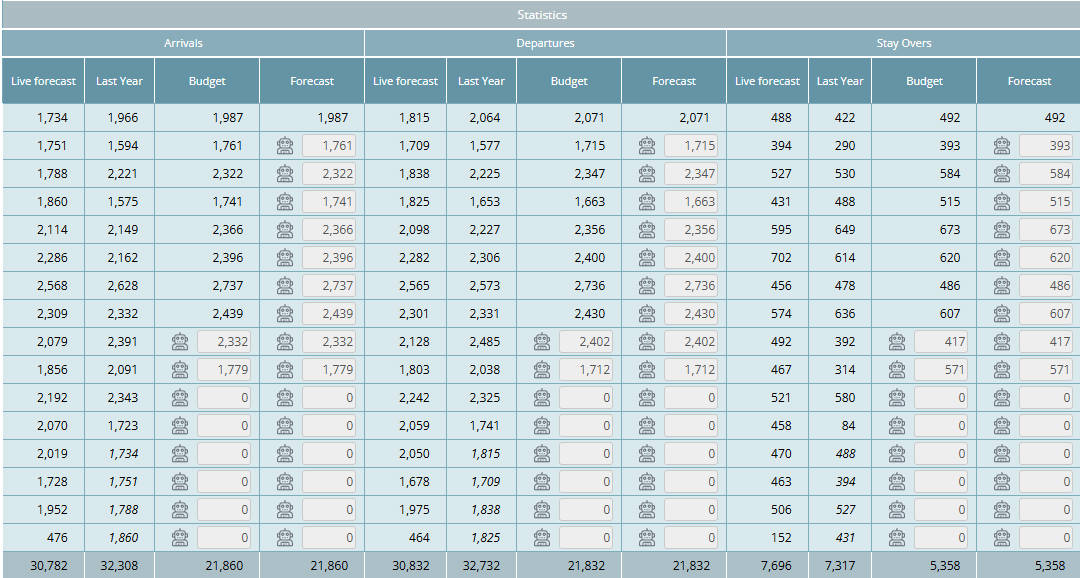
Budget and forecast – Arrivals, departures, and stay over forecasts
View and manage arrivals, departures, and stay-over statistics directly in Budget and forecast.
Arrivals, departures, and stay-over statistics are now available in the Budget and forecast module.
This allows you to review monthly totals and adjust them when needed, helping you better align operational statistics with your revenue and room forecasts.
Why is this useful?
- Get a quick overview of monthly arrivals, departures, and stay-overs
- Compare operational statistics alongside your room and revenue forecasts
- Adjust monthly arrivals, departures, and stay overs when needed
- Support more accurate planning across departments
What has changed?
- Added a statistics section in the Budget and forecast module with monthly totals for arrivals, departures, and stay overs.
- The tool setting “Enable live forecast arrivals, departures, stay-overs” has been removed. Forecasts are now generated automatically.
Where to find it
Go to: Budget and forecast → statistics section (right side)
Available for users with access to the Room Budget and forecast.

Image: Budget & forecast statistics information - arrivals, departures, stay overs
Learn more:
For more information, go to Arrivals, departures and stay over visibility
Live Forecast does not match OTB
If Live forecast shows a large gap versus OTB (e.g. OTB = 97 RN and Live = 37 RN), first check the update method.
Go to: Live forecast → Tools → Configuration settings
Under Live forecast update method, verify:
- Auto: Updates when new external file is imported
- Auto: PMI prediction updates daily ✅ (recommended if you do not import forecast files)
If “Updates when new external file is imported” is selected and no forecast file is uploaded, the Live forecast will not refresh and may not reflect current OTB.
👉 If you are not using forecast imports, switch to: Auto: PMI prediction updates daily
This ensures the Live forecast is recalculated daily and aligned with OTB + expected pickup.
Why does TKS mapping have proportional cost rates, and what do they affect?
Problem
You saw an option in the Timekeeping System (TKS) mapping to assign different proportional cost rates and wondered:
“If I pay someone at 20% of the normal rate, why can’t I reduce their hours for RevPOLU / PMI?”
Explanation
In PMI, hours and cost are handled separately:
- Hours represent actual worked time and are used in productivity KPIs like RevPOLU.
- Cost rates in TKS mapping adjust how labor cost is calculated — they do not affect the number of hours used in productivity metrics.
So even if someone is paid at a reduced rate (e.g., 20%), you should still log all hours worked. Their cost will be calculated correctly based on the proportional rate you set in TKS mapping.
This ensures:
- Productivity measurements remain accurate, and
- Labor cost reflects the actual pay arrangement.
Key point
TKS proportional cost values only affect cost calculation, not the hours logged for productivity metrics.
Why can’t I edit a calculation in P&L Planning?
If you cannot edit a value or formula in P&L Planning, the reason is usually one of the following:
1. The account has a Source Definition
If you see a calculator icon on the account line, the value is controlled by a Source Definition. You cannot type directly in the cell. To adjust it, open the Source Definition and edit the setup there.
See: How to populate and edit accounts
2. The account is a parent (summary) account
If the account has sub-accounts underneath it, it is summing those values.
Parent accounts cannot have their own formulas.
Edit the calculation on the sub-accounts instead.
See: How to populate and edit accounts
3. The version or period is locked
Editing may be restricted if:
- The version is submitted or locked
- The period is locked
- You do not have sufficient access rights
Check your View Options and confirm you are working in an editable (WIP) version.
See: Planning Menu – Tools and View Options overview
4. The cell was manually overridden
If a month was manually edited, the formula may be overridden for that period.
You may need to reset the cell to restore the calculation.
For differences between manual input and Source Definitions:
See: Input methods in Planning: manual, even and source definition explained
If you still cannot edit the account, contact your system administrator to verify permissions and account configuration.
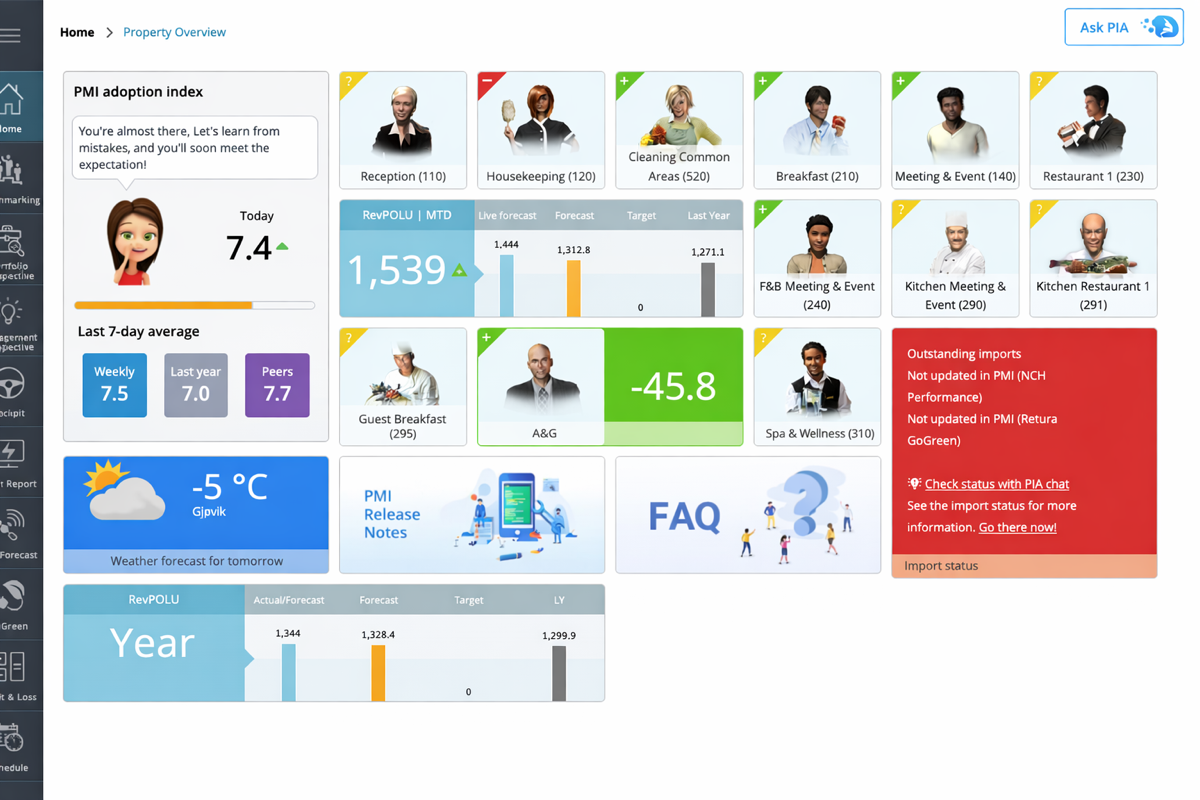
PIA chat powered by GPT-5.1 is now available to all users
We’re excited to announce that PIA, your PMI chatbot, is now available to all users!
You can access PIA Chat anytime via the “Ask PIA” icon in the top-right corner of your screen.

Powered by GPT-5.1, PIA delivers faster, smarter, and more context-aware answers to help you navigate PMI, understand features, and find exactly what you need—right when you need it.
We’d love your feedback! 👍👎
After using PIA, please share a thumbs up or thumbs down to let us know how it performed. Your feedback directly helps improve accuracy, relevance, and the overall experience.
Start exploring with PIA today—and help us make it even better!
Related articles:

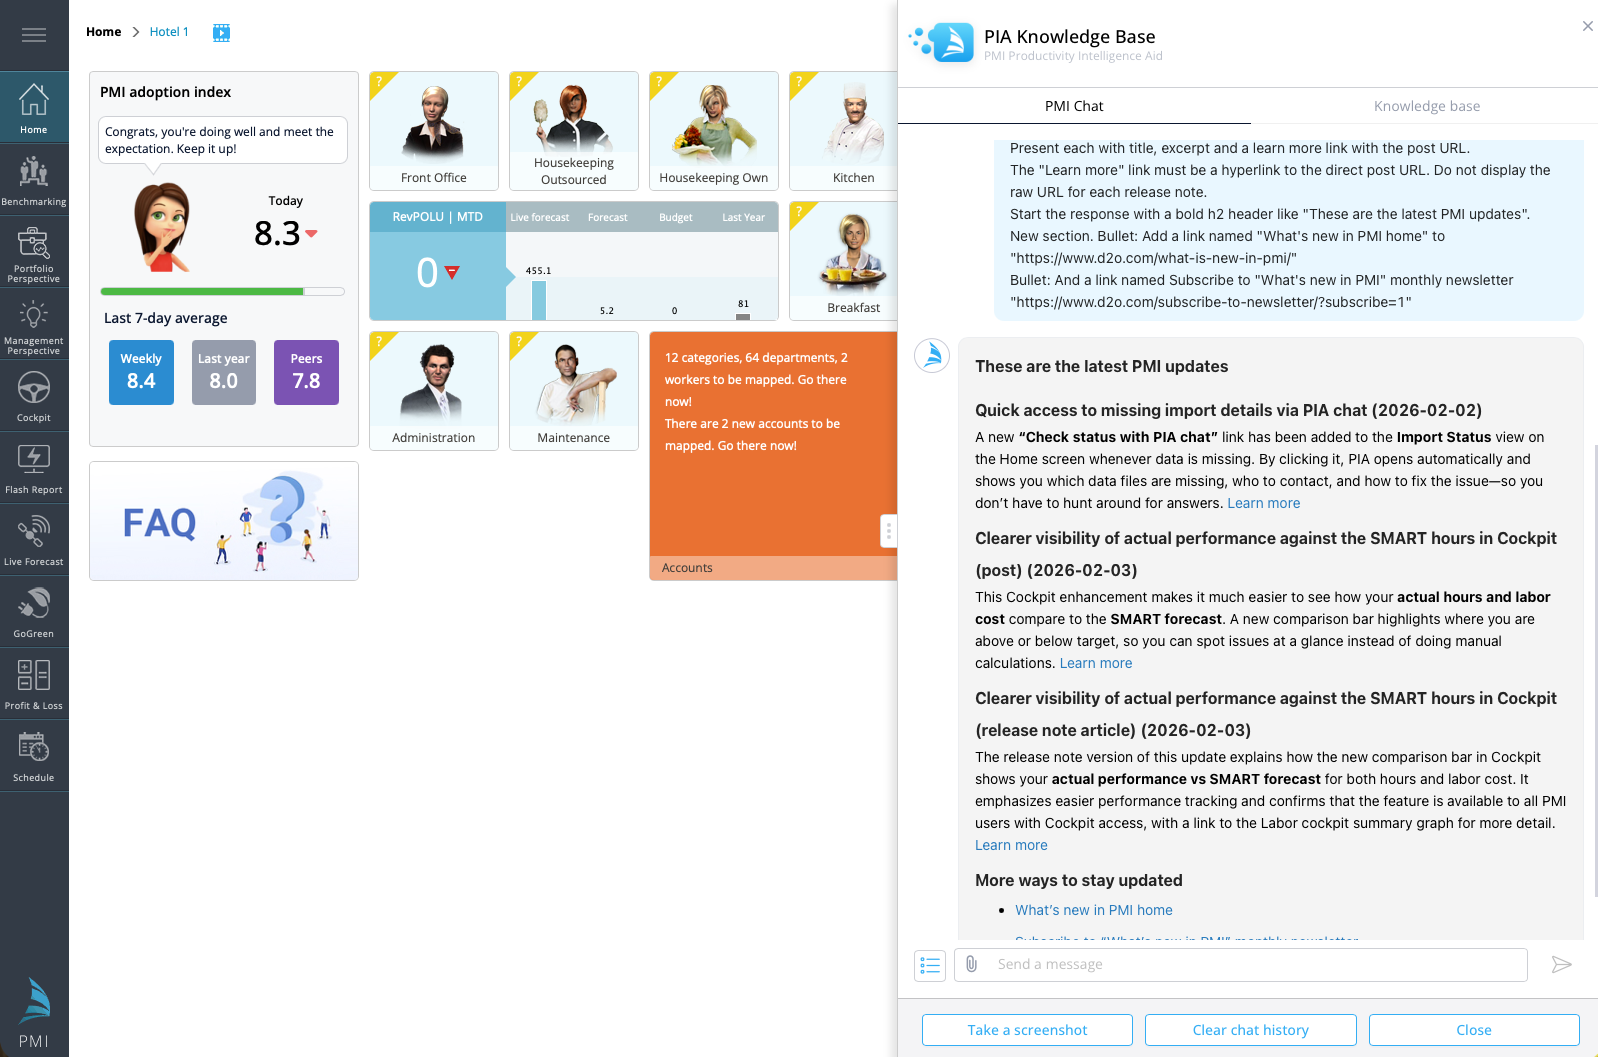
What’s new in PMI – Release notes
We’ve introduced a new home for PMI release notes. Starting with 2026 releases, all updates are now published in this new, improved format to make it easier for you to stay informed about the latest features, enhancements, and improvements.
Release notes from 2025 and earlier will remain available in the Knowledge Base, so you can still access historical updates whenever needed.
You can access the new Release Notes page directly from the “What's new in PMI” button on the Knowledge base landing page.
- Visit the Release Notes page: What's New in PMI – Release Notes
- Subscribe to the "What's New in PMI" monthly newsletter to receive updates straight to your inbox.
Period locking – GoGreen consumption periods can now be locked
You can now lock GoGreen consumption periods in addition to Revenue & Hours (R&P). This means manual edits to GoGreen actuals (e.g., electricity, gas, chemicals) can be restricted once the data has been reviewed or reported.
More improvements:
- The Period locking page has also been updated: it now shows lock status more clearly, with improved navigation and styling for both R&P and GoGreen.
- Property exceptions have been improved. Chain-level changes now automatically apply to property exceptions for months and data types where no manual override exists.
- All changes done in Period locking is now added to the Activity log with detailed information.
Why it’s useful
These updates help keep both R&P and GoGreen data stable after review, reduce the risk of late or accidental changes, and make it easier to see when a period is no longer editable.
Availability
- R&P: HQ Administrator and HQ Controller roles.
- GoGreen: GG Admin role with chain-level access.
- View-only: All other main roles (except View PMI) can view periods and exceptions but cannot edit.

New Type: GoGreen
Learn more
To understand how this works and how to use it, see:

PMI Views
PMI views are organised by modules, as they appear in the main navigation menu. Some modules are always visible, while others depend on activated features, user roles, or chain configuration. The same view name (for example Cockpit) can exist in different modules and serve different purposes.
Administration and Help are not modules by themselves. They are foundational areas in PMI that collect administrative and support views from all active modules. When a module (for example PMI+, GoGreen, or CoE Analytics) is activated, it can add its own configuration, mapping, or support views under Administration and Help. This means the content of these sections may vary between users, chains, and system setups.
PMI R&P (always visible)
Core navigation
- Home
- GM daily digest
Operational execution
- Cockpit
- Schedule
- Time Sheet
Forecasting
- Live Forecast
- PMI Live Forecast Accuracy
- Pickup Statistics
- Target & Forecast
Performance & management
- Management Perspective
- Flash Report
- Benchmarking
- Portfolio Perspective
- PMI adoption index
- KPI targets
Demand & segmentation
- Segment OTB
- Consolidation OTB
PMI Planning
PMI P&L
- Profit & Loss
PMI Plus (PMI+)
- PMI+ Forecast
- PMI+ Project Forecast
- PMI+ Finance Reports
- PMI+ Target
PMI+ Setup & configuration
- PMI+ Report Setup
- PMI+ Finance Settings
- PMI+ Finance Operation
- PMI+ Fee Setup
- PMI+ Distributed Input Settings
GoGreen
- Home
- Cockpit
- Task bank
Administration
User & structure
- Settings
- User administration
- Hierarchy
System & data
- Advanced Settings
- Global Settings
- Data Upload Centre
- Import status
- Activity Log
Planning & governance
- Planning setup
- Goal distribution tool
Content & AI
- User feedback
- Text authoring
- AI Admin
Mapping & productivity
- Mapping - Accounts
- Mapping - Time Keeping System
- Mapping - FB PowerBI
- Productivity Analyzer
Analytics (admin entry point only)
- CoE analytics suite - R&P
- CoE analytics suite - F&B
Chain context
- Select other Chain
Help
- Contact support
- Documents
- PMI Knowledge Base
- PMI FAQ
- Release Notes
Note on CoE Analytics placement
CoE Analytics (R&P and F&B) are analytics views, not administrative tools. They currently appear under
Administration for technical and access reasons, but functionally they behave as read-only
analytics views and do not change system configuration.
Clearer visibility of actual performance against the SMART hours in Cockpit
You can now see more easily how your actual performance compares to your SMART forecast directly in the Cockpit, for both hours and labor cost. A new comparison bar highlights the difference, making it even easier to spot where performance is above or below your target.
Why is it useful?
Easier to see whether teams are performing well compared to the ideal SMART plan, without having to do manual calculations.
Availability
Available to all PMI users with access to Cockpit.
Learn more
See the Labor cockpit summary graph for more details.

Image description: A new bar to the left in the graph indicates the comparisson of actual performance vs SMART hours
Quick access to missing import details via PIA chat
A new link has been added to the Import Status view on the Home screen when data is missing.
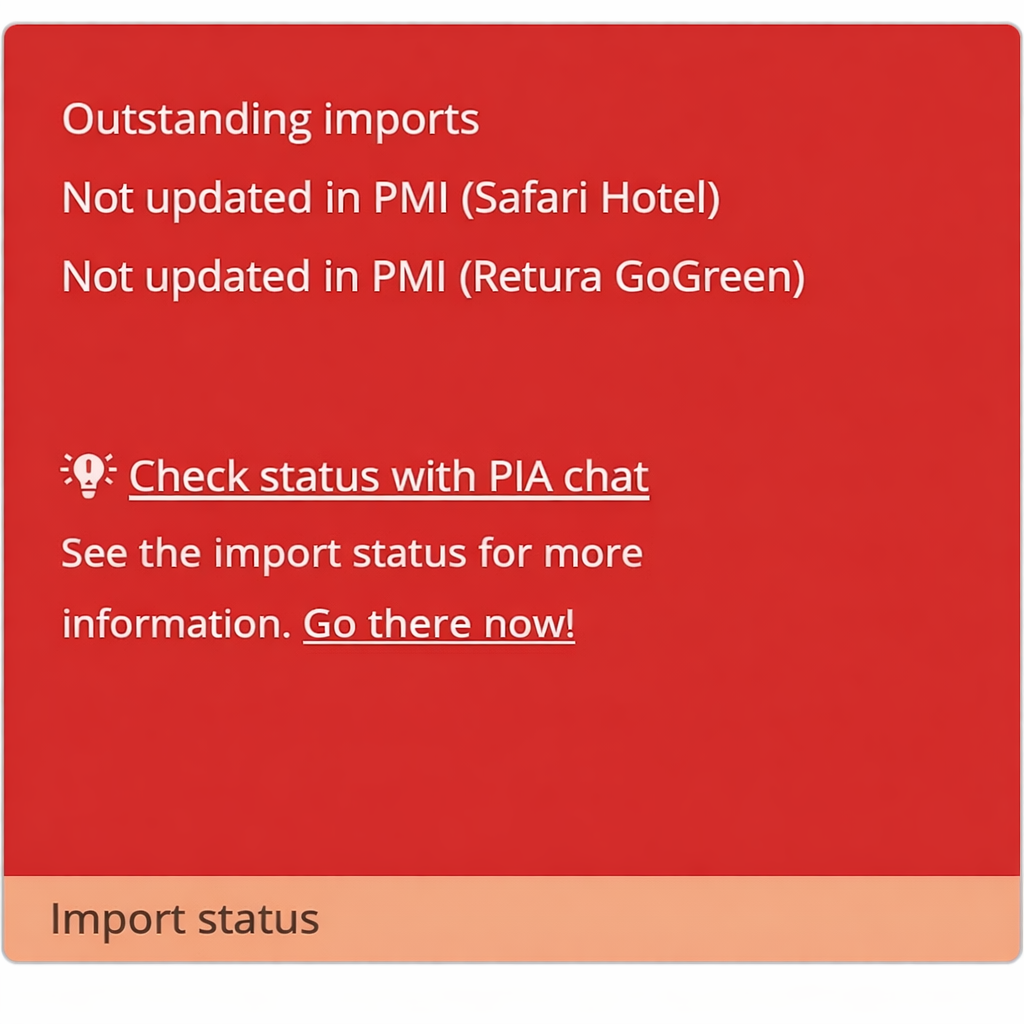
By selecting “Check status with PIA chat”, PIA will open and automatically display:
- The missing data files
- Relevant contact information
- Guidance on how to resolve the issue
This makes it faster and easier to understand why data is missing and what actions are needed to restore it.
How manual pickups affect Food Revenue when F&B Live Forecast runs on Total level
When the F&B Live Forecast is configured to forecast Total Revenue, any manual pickups are applied to the total Live Forecast amount for the profit center. The pickup itself is not food-specific.
How Food Revenue is calculated
Food Revenue is derived from Total Revenue based on:
- Account mapping. Revenue accounts marked as Food define the historical food share used by PMI.
- Live Forecast (Other revenue) configuration. If Food Revenue is enabled, PMI calculates Food Revenue from Total Revenue using one of the following methods:
- a fixed percentage, or
- Last Year ratio (recommended), which reflects seasonal business mix.
What happens when a pickup is added
- The pickup increases or decreases Total Revenue in the Live Forecast.
- PMI recalculates Food Revenue using the configured Food Revenue logic.
- The adjusted Food Revenue flows through to all areas where it is used.
Impact on Cockpits
Any cockpit that uses Food Revenue as a cost driver (e.g. Labor or Food Cost) will automatically reflect the change caused by the pickup.
Key takeaway
Manual pickups at total level affect Food Revenue indirectly, via the Food Revenue configuration in the Live Forecast, which is informed by historical account mapping. This behavior is expected and ensures consistency across PMI.
Sick leave short-term hours view option in Benchmarking
You can now choose to view ‘Sick leave short-term’ hours as a separate column in Benchmarking.
What’s new:
The ‘Total absence’ column (showing hours and a percentage of total hours) has been part of the Benchmarking Productivity view.
A new option in your view settings allow you to display ‘Sick leave short-term’ hours alongside the ‘Total absence’ column.

Benefits:
Provides a clearer overview of sick leave as part of non-productive hours.
Availability:
This option is available only if the ‘Sick leave short-term’ has been mapped to a category in the TKS mapping.
For more information contact support@d2o.com.
Image description: Benchmarking with new view activated: Sick leave short-term
Why CoE screenshots can look “empty” when you inspect them
If you’ve noticed that screenshots captured in CoE appear blank/empty when you open or inspect them, this is expected behavior for Power BI views.
Power BI visuals are often rendered dynamically (client-side), and the “image” you see on screen isn’t always stored as a traditional, fully-populated bitmap in a way that survives inspection/export the way a normal webpage would.
What actually matters:
PIA doesn’t rely on the screenshot content for the data. When the screenshot step is triggered, PIA fetches the actual data directly from the Power BI source via the Microsoft API, using your specific chain/property context. In other words:
- The screenshot is mainly a trigger to initiate a refresh/update
- The data itself comes from the API, not the captured pixels
- So even if the screenshot looks empty, PIA still retrieves the right dataset for your chain/property
Net: the screenshot is a switch, not the payload.

How to contact d2o support
If you’re experiencing an issue in PMI, you can reach our support team:
- Email: support@d2o.com
- Submit a support ticket: Create a request here
No matter how you contact us, we’re here to help get you back on track quickly!
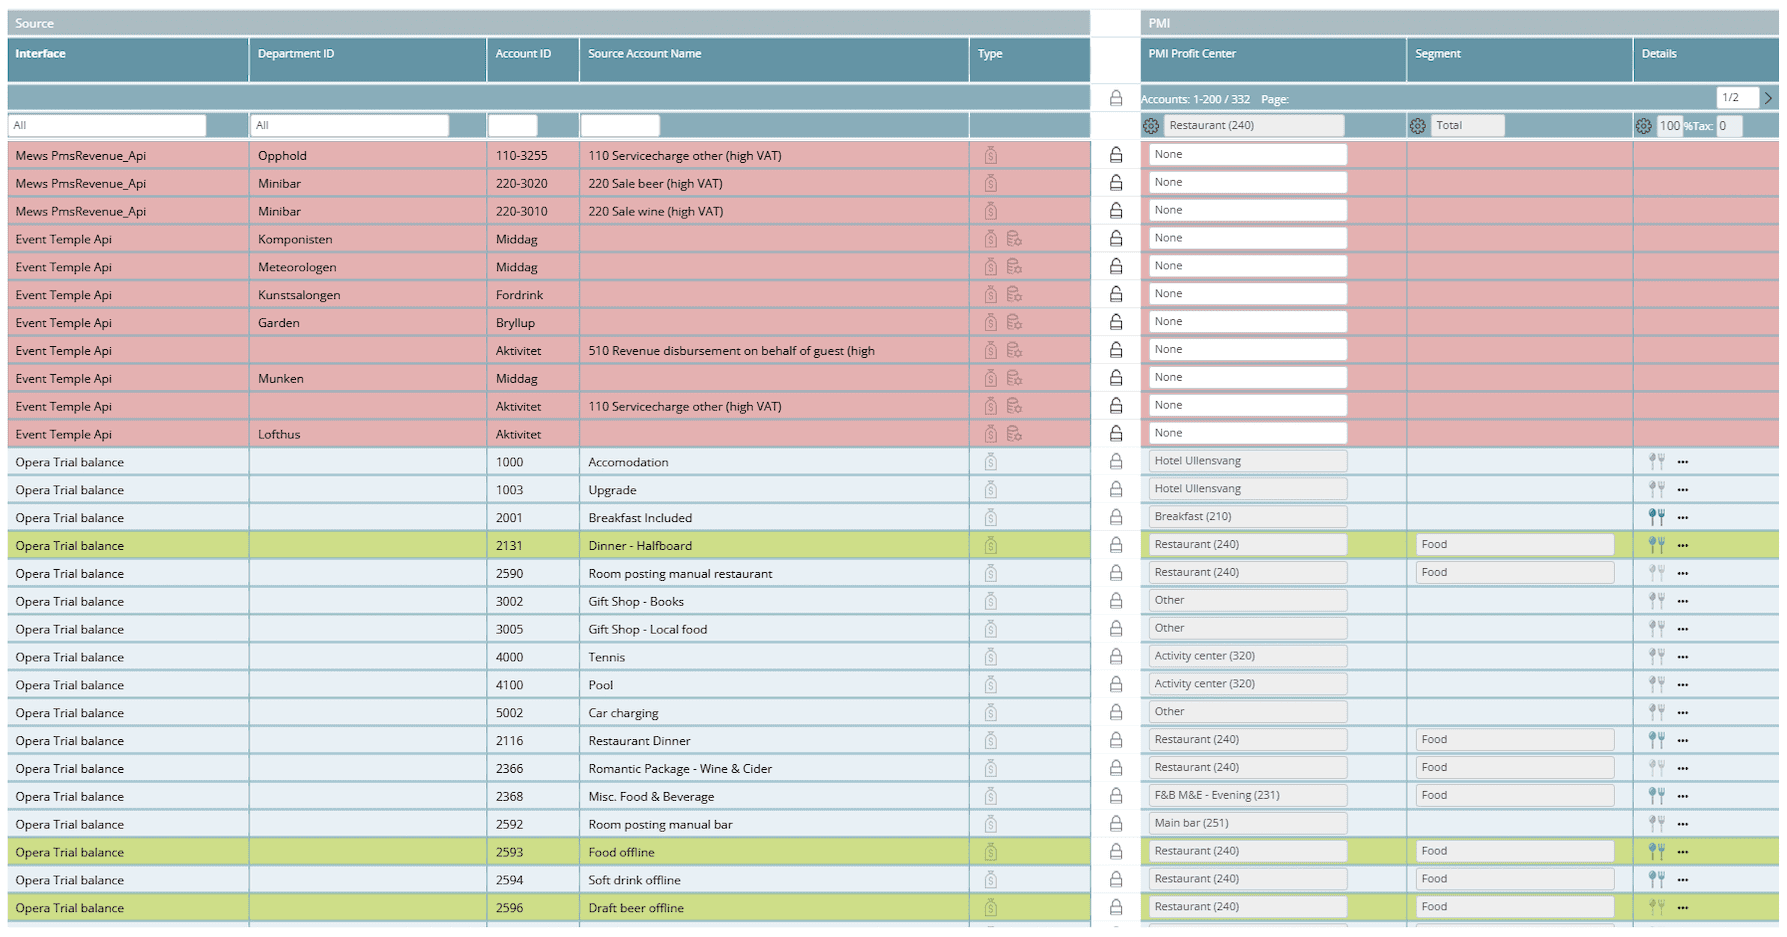
Why rows turn green, red, blue or grey in the account mapping table
What the Row Colors Mean in the Account Mapping Table
The Account Mapping Table uses color indicators to help you quickly understand the status of each row and determine whether any action is required. PMI does not automatically map new accounts; however, it may automatically remap existing mapped accounts when hierarchy changes occur.
Below is an overview of what each color represents and how to troubleshoot them.
Red Rows (Action Needed)
Red highlights indicate unmapped or incomplete mappings.
Typical reasons:
- The segment or profit center is missing.
- The source account has not been assigned.
- A hierarchy change made the old mapping invalid.
What to check:
- Make sure a valid PMI Profit Center and Segment are selected.
- Review any recent hierarchy changes (segments added/removed).
Blue Rows (Mapped Manually / Stable)
Blue rows represent valid manual mappings.
- There is no issue.
- The mapping has been reviewed and saved.
- No hierarchy changes affect the mapping.
These rows are considered “complete” and do not require action.
Green Rows (Automatically Remapped)
Green rows show accounts that PMI remapped automatically due to a change in the hierarchy.
Typical triggers:
- A segment was added or deleted.
- An old segment no longer exists.
- Profit centers were reorganized.
- A new version of the hierarchy was imported.
PMI attempts to preserve continuity by remapping the account to the nearest valid equivalent.
Troubleshooting tip:
If an auto-remapped row looks wrong:
- Verify the latest hierarchy update.
- Reassign the correct PMI Profit Center or Segment manually.
- Save the mapping.
- If the incorrect auto-mapping keeps reappearing, report it to support (usually indicates an upstream hierarchy mismatch).
Grey Rows (Locked or Ignored)
Grey rows can appear for two different reasons:
1. System-controlled (locked):
- These mappings come from certain automated imports.
- The row cannot be edited by the user.
- A lock icon is usually visible.
2. User-set as “Ignored”:
- Users can manually mark a row as ignored when the source account should not be mapped into PMI.
- This allows you to keep the row visible for reference while explicitly excluding it from processing.
- Ignored rows remain grey but not locked, and can be reverted by the user at any time.
Summary
Red
- Meaning: Missing or invalid mapping
- Action: Yes
Blue
- Meaning; Manually mapped and valid
- Action: No
Green
- Meaning: Auto-remapped after hierarchy change
- Action: Optional (verify correctness)
Grey
- Meaning: Locked by system or manually ignored by user
- Action: Only if unintended
Can’t find RevPOLU in the Flash report
RevPOLU is not displayed in the Flash report.
Flash focuses on pacing and performance for each revenue centre using Forecast, Budget, and Last Year as comparison points. Because of this scope, the report does not include RevPOLU as a metric. Flash also uses a different calculation methodology: its month-end figures follow revenue-centre pacing logic, whereas RevPOLU is based on unit-level revenue logic.Why users often look for RevPOLU in Flash
RevPOLU (Revenue per Occupied/Leased Unit) is used in other PMI views such as Management Perspective and the GM Daily Digest to analyse revenue performance at a unit level. Users sometimes expect Flash’s month-end live forecast to follow the same logic.How Flash compares
While Flash does not calculate or display RevPOLU, its live forecast month-end figures use pacing logic focused on revenue centres, not unit-based revenue logic. This means:- Flash = revenue pacing against Forecast / Budget / LY
- RevPOLU = revenue normalised per occupied/leased unit
Where to monitor RevPOLU
To review RevPOLU trends and comparisons, use:- Management Perspective → Revenue & Rooms KPIs
- GM Daily Digest
Why PMI might feel slow today
PMI occasionally feels a bit slower when it’s handling unusually large background tasks — for example, during major data imports or when running heavier forecasting recalculations.
Many properties tend to submit budgets and forecasts around the same time at month-end, but this alone doesn’t normally cause performance issues. It can, however, coincide with other intensive processing tasks, which may make dashboards or reports load more slowly until those tasks finish.
These situations are rare and usually resolve quickly.
If something feels off or the delay lasts longer than expected, feel free to check back or let us know — we’re always happy to help keep everything running smoothly.
Holiday Hours in PMI
Holiday hours (paid holidays / paid time off) should not be entered into PMI. Only hours that were actually worked, whether regular or overtime, are reported in the system.
Paid time off does not contribute to productivity calculations and should be excluded to ensure accuracy in labour metrics. If employees worked on a holiday, those hours are entered normally as productive hours. If employees were off with paid holiday leave, those hours should not be added. This rule prevents inflation of total labour hours and keeps productivity reporting aligned with PMI’s intended methodology.
Example From the Labor Cockpit Article
“Paid time off for full-time employees should be ignored in PMI.”
(This includes vacation days and paid holidays.)
Deleting or Removing Users in PMI
If you’re having trouble deleting a user from PMI, for example, when a colleague leaves your property or their account still appears active, this issue is usually related to how user permissions and property associations are managed. Deleting or removing users depends on whether the user exists only at your property level or across the broader PMI system.
To resolve common questions and issues related to user removal, please refer to the following articles:
- One of my colleagues no longer works here – how do I delete their PMI user and access?
- User Administration Enhancements – March 2024
- User Administration Overview
- Remove User – Property vs. PMI
Labour cockpit – Understanding Smart MTD vs. Smart Month-End Hours
Smart MTD hours (month-to-date) and Smart Month-End hours represent different time perspectives of the same Smart forecast.
Smart MTD shows the cumulative Smart hours up to the current date, while Smart Month-End shows the full-month projection.
The way these hours are calculated may differ depending on how your Smart forecast is configured — either using a primary cost driver only or machine learning (ML).
These two calculation approaches result in different daily distributions and therefore may lead to differences in calculation approaches between Smart MTD and Smart Month-End values.
Total monthly SMART hours calculation:
If the Target is set to Productivity, then the formula used will be:
Total month Cost driver divided by Forecasted Productivity. This is true for either of the two settings described below.
SMART calculation options
Scenario 1: When Smart uses a Primary Cost Driver only
- In this setup, Smart forecast calculates daily hours directly from the selected cost driver.
- Formula: Daily Smart hours = Cost Driver value ÷ Forecasted Productivity
- Each day’s Smart value is determined only by that day’s cost driver, and the MTD (month-to-date) total is simply the sum of all daily Smart hours so far.
Scenario 2: Smart forecast calculated using Machine Learning (ML)
- In this setup, the Smart forecast on individual days is calculated by machine learning (ML) rather than relying only on the primary cost driver.
- Each day’s Smart value is based on historical patterns, trends, and seasonality, allowing the system to reflect realistic fluctuations in workload across the month.
Because of this:
- You cannot calculate Smart MTD hours by dividing the MTD cost driver value by the forecasted productivity.
- The correct Smart MTD value comes from the sum of daily Smart hours generated by the ML model.
- During the month, MTD productivity may differ from the forecasted productivity because of how the model distributes expected workload.
Tip
To confirm which setup your Smart forecast uses:
- Go to Cockpit → Tools →Settings.
- Check if Use only primary cost driver in SMART is selected.
If ML is used, differences in calculation approaches between Smart MTD and Month-End hours are expected and do not indicate an error.
More than 1000 properties are d2o customers
The d2o customer base continues to grow steadily
Here is a snapshot as we head into Q4 2025:
- 1,000+ hotel chains and properties across multiple markets
- 21,000+ hoteliers leveraging PMI to improve daily performance
- <1% adoption of PMI Plus, our most advanced module, reserved for the truly data-driven elite
- 57%+ of customers actively using the GoGreen module, aligning operations with sustainability goals
- 35%+ adoption of CoE R&P and CoE F&B, streamlining operations and optimizing resources
As adoption grows across all modules, we’re proud to support hoteliers in making smarter, greener, and more profitable decisions, every single day.
Last Year productivity shows as 0 in Budget & Forecast Issue
The Last Year productivity column in Budget & Forecast may display as 0.00, even though actuals (hours, room nights, revenue) exist for the period.
Symptoms
- In Budget & Forecast, LY productivity = 0.
- In Cockpit, LY hours are visible.
- In Live Forecast, LY cost drivers are visible.
- Despite this, productivity is not calculated in Budget & Forecast.
Cause
This might not be a bug.
- Budget & Forecast only displays the last saved Cost Driver values.
- If past months were never saved in Cockpit, LY productivity appears as 0.
Resolution
- Open Budget & Forecast → Cost Driver tool.
- Click Save/Update.
- This re-calculates the cost drivers for all periods (may take 5–10 minutes).
- Refresh Budget & Forecast → LY productivity should display correctly as soon as the update is completed.
Notes
- If the issue affects multiple hotels in a chain, support can trigger an auto-save across all cockpits to backfill past years.
- For individual hotels, users can apply the fix manually as described above.
PMI navigation — 3 levels to remember
About PMI Modules and Navigation
PMI is structured into modular components to help users navigate tasks efficiently. Understanding how modules, views, and pages are organized will help you find the right workspace quickly—whether you’re analyzing revenue, adjusting forecasts, or tracking sustainability goals.
PMI modules overview
PMI is built around a core module with several optional premium add-ons designed to extend functionality based on your property’s needs.
Core Module
- PMI R&P (Revenue & Productivity). The central hub for real-time tracking of revenue, labor hours, and productivity across all departments.
Premium Add-On Modules
- PMI Planning (P&L). Enables detailed financial planning and budgeting across operational areas.
- PMI Plus (requires PMI Planning). Enhances Planning with advanced scenario modeling, resource optimization, and “what-if” simulations.
- GoGreen. Delivers sustainability metrics and environmental impact tracking to support eco-conscious operations.
- CoE Analytics – R&P. Pre-built Power BI dashboards that visualize revenue and productivity KPIs with interactive drill-down capabilities.
- CoE Analytics – F&B. Focused Power BI package for Food & Beverage performance, including menu engineering, cost of goods sold, and sales mix analysis.
View
What it is: A view is the primary workspace within a module. It loads inside the PMI interface and displays the data, tools, and widgets relevant to a specific task or focus area. The name of the view appears in the page header when it’s open.
Examples: Cockpit, Schedule, Live Forecast, Flash Report, Management Perspective, etc.
Tip: Think of a view as the “room” you’re working in—each one is designed for a specific purpose and comes equipped with tools to match.
Page
What it is: A page is a specific tab, department, or sub-section within a view. It reflects the area or dataset you’re currently examining and appears in the breadcrumb trail after the view name.
Examples:
- R&P → Cockpit → Front Office
- Planning → Profit & Loss → Accounts
- GoGreen → Cockpit → Water (Doing)
Tip: Think of a page as the section of the room you’re working in—it narrows the focus within a broader workspace.
Flagging one-off events
Scenario: A single day (concert, trade-fair, planned outage, etc.) will spike or dip demand. If you leave it untouched, PMI Prediction will use normal history and likely forecast too low (or too high). After the day passes PMI will auto-classify it as an outlier, but you still need an accurate forecast today for staffing and revenue planning.
Step 1 – Override the day in Live Forecast
- Go to Rooms ▸ Live Forecast.
- Select the unusual date.
- Switch the cell to manual and enter the room-nights and ARR you expect.
Step 2 – Save / Send to Forecast
Click Save / Send to Forecast (green button).
This locks your manual value and pushes it to Cockpits and labour tools so staffing and cost-drivers follow the adjusted forecast.
What happens next?
- During the day: all reports, RevPOLU, and staffing hours use your manual forecast.
- After the day closes: PMI will automatically decide whether that date should be flagged as an outlier. If it is, the spike won’t distort future ML forecasts—no extra action needed.
Remember: manually overriding the Live Forecast fixes today’s planning; it does not teach the model a new pattern. Only the outlier engine—run after actuals arrive—decides whether to exclude the date from future history.
Which department should I fix first in the PMI Adoption Index dashboard?
Use the “Weight (high → low)” view and follow this checklist in the PMI adoption index.
Colour only shows how far off-target a department is.
Weight shows how much that miss drags the hotel’s score.
Fix the first bar that combines low colour and serious weight—sometimes that’s a wide amber, not a thin red.
1. Find the first non-green bar
- Green = on target → skip.
- Amber / Red = below target → stop here. Amber or red bar carries the biggest weight (%), so turning it green lifts the hotel score quickest.
2. Colour vs Weight — who wins?
- Red + real width (≈ ≥ 5 %) → fix first. It hurts twice (low score and big weight).
- Thin red (< ≈ 2 %) → ignore until the wide ambers are fixed.
- Widest amber beats skinny red every time – weight moves the index more than colour once reds are just slivers.
3. Open the tile → attack the fattest routine group
- Click the bar (or Switch to table view ▸ View measurements).
- Four routine groups appear: Plan / Do / Monitor / Adjust.
- Start with the group that shows the highest weight – that’s the fastest win.
4. Park the low-impact stuff
- Bars under ~2 % weight can wait until heavyweights are green.
- Tech tiles (e.g. Integration status) only matter if data is actually missing – they don’t influence the Adoption Index.
Quick rule-of-thumb
- Fat red? (wider than a fingertip on screen) → fix it.
- No fat reds? → fix the widest amber.
- Work left-to-right until every bar is green or too thin to move the needle.
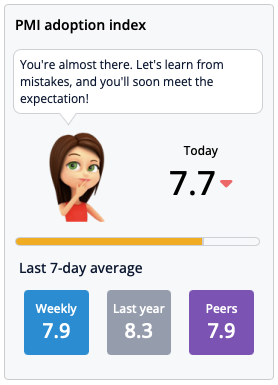
PMI adoption index is dropping – Quick troubleshooting guide
Symptom: PMI Adoption Index slips below the target (8.0) or the Index trend graph shows a downward slide.
1. Pin-point the heaviest drag
- Open Organization overview.
- The thicker the green / orange bar, the more weight that department (or routine) carries in the total score.
- Start with the bar named in Department to focus on – lifting that one moves the needle fastest.
Tip: Skip hygiene tiles for now. “Hygiene factors” show operational health, but in the Adoption Index their weight is 0 %. Fix them after the high-weight bars are green.
2. Open Score breakdown
Red and amber slices expose which routines are off-track.
Typical trouble spots and one-minute checks:
- Scheduling discipline: Cockpit banner red or amber? Open the Cockpit and click Save.
- Labour forecasting: Next month still Pending? Submit or lock the forecast.
- Productivity accuracy: Live Forecast > 10 % away from Forecast? Review cost-driver or hours and resave.
- Hygiene factors: (red triangle or amber “?”) Enter missing hours, clear warnings.
3. Run the daily hygiene for that department
Make sure, for yesterday:
- Live Forecast saved (no red triangle).
- Cockpit saved (banner turns green).
- Schedules sent to Forecast.
- Current month status = Live; next month = Ready / Locked.
Do this today – the Adoption tile recalculates overnight.
4. Coach for consistency
- Ask the HOD to repeat the same four-point check every morning.
- Show the payoff: higher RevPOLU, fewer last-minute edits, smoother staffing.
5. Re-check tomorrow
- The headline score should tick up after one night.
- If it doesn’t, tackle the next-largest red / amber slice and repeat.
Ignore technical tiles such as Integration Status unless data is actually missing – they don’t influence the Adoption Index score itself.
Why can’t I see the “ Add Note ” icon in a department’s Schedule table?
Symptom
In one cockpit the Schedule table shows no note icon beside the daily hours, while other departments do show it.
Cause
That cockpit contains more than one schedule row for the same day (e.g., “Front Office – Scheduled” + “Reservation desk”).
When several rows exist, PMI collapses them into a single line. The note icon only appears once you expand the day so PMI knows which row you want to annotate.
Quick fix
- In the Schedule table, click the plus symbol to expand the date.
- Each underlying schedule row now displays its own note icon.
- Click the icon, type your note, Save, and collapse the day again if you like.
Tip
If you often use notes, keep the days expanded while you’re adding comments, then collapse them for a cleaner view.

GoGreen – “Green-Light” Routine
Every day
1. Banner is green? Great – data’s in. If red, chase the missing file.
2. Progress bar colour:
- • Red bar → already over target → find the leak today.
• Amber bar → slightly above forecast → ask the team what changed.
• Green bar → on pace → no action.
3. Leave a one-line comment (“Boiler fault – gas up 18 % – engineer booked”).
4. Update your tasks (tick what’s done, add new fixes).
Every week
1. Scan the 12-month consumption chart
- Look for any resource line that is creeping up – tackle it before budget season.
2. Export scores (Excel)
- Send the file to Engineering and the F&B cost controller.
- Agree who owns each amber/red variance.
3. Update the SMART forecast if operations changed
- Big event cancelled? Enter a negative adjustment so the target resets and the team isn’t “over” for no reason.
4. Tidy the cockpit
- Clear any lingering red banners (missing days).
- Archive completed tasks so only live actions remain.
5. Celebrate wins
- If the monthly bar is green and trending down, grab a screenshot and share it on the staff board – positive feedback drives future engagement.
Remember the order
- Data banner – proof the numbers are fresh.
- Progress bar – shows whether you are on pace.
- Comments – turn facts into context.
- Task-bank – turns context into action.
Switching the temperature from °F to °C (or back)
PMI doesn’t have a separate “units” toggle; the temperature follows your personal language/locale.
- Profile menu: Click your name (top-right) ▸ Settings / Personal preferences.
- Change language
- English (UK) → Celsius (°C)
- English (US) → Fahrenheit (°F)
- Save & refresh: Log out / in (or refresh the browser). The weather icon now shows the new unit.
Generate reports in the Timesheet
If you have trouble to generate (make or create) a report in the timesheet, one common solution to try is checking your view settings. Specifically, make sure you've included all necessary parameters, such as "Include Period-End" in your report criteria. This step is often overlooked but crucial for generating comprehensive reports that match your expectations. If you're still encountering difficulties, you might need to look into more detailed settings or permissions that could be affecting your ability to generate the report.
Scheduled Horizon Misunderstanding
The Scheduled Horizon setting often leads to confusion. Adjusting it does not affect the import of hours from your Timekeeping System (TKS). It only determines how far into the future you can view data. If you’re missing data, the issue likely lies with TKS data or mapping settings, not the Scheduled Horizon. There are visual differences in the appearance of the Today and Scheduled Horizon lines, as described below:
Cockpit View:
- Day-to-day graph:
- Black dotted vertical line: represents today’s date (Today Line).
- Green dashed vertical line: marks the end of the Scheduled Horizon.
- Cockpit Table:
- Horizontal red line: indicates today.
- Horizontal green line: shows the end of the Scheduled Horizon.
Schedule View:
- Vertical red line: represents today’s date (Today Line).
- Vertical green dashed line: shows the end of the Scheduled Horizon.
Links:
SSO login
Single Sign-On (SSO) simplifies the login process by allowing you to access PMI with your organization’s credentials without needing a separate password for PMI. Here is how it works:
- Navigate to the PMI login page, there you should see an option for Single Sign-On or a similar SSO login button.
- Click that SSO button and you will likely be redirected to your organization’s standard login page.
- Enter your organization username and password as you usually do.
After successful authentication, you will be redirected back to PMI and logged into the system .
Multi-Factor Authentication (MFA): Adds an additional layer of security by requiring users to provide a second form of verification (like a mobile app, SMS code, or biometrics) during the login process. Typically, MFA is enforced at the identity provider level (e.g., AAD) when users authenticate via SSO.
Password reset from the login page
How to Reset Your Password:
Resetting your password in PMI is straightforward. Follow these steps:
- Log in to PMI and navigate to the Main Menu.
- Select Settings from the menu options.
- On the Settings page, locate the option to Change Password.
- Enter your current password, then type your new password, ensuring it meets the security requirements.
- Click Update to save your changes.
Your password will now be updated, and you can continue using PMI with your new credentials!
Password Requirements: PMI enforces strict password policies to ensure account security. Passwords must meet the following criteria:
- Minimum Length: At least 8 characters.
- Uppercase Letter: At least one uppercase letter (e.g., A).
- Lowercase Letter: At least one lowercase letter (e.g., a).
- Number: At least one numeric character (e.g., 1).
- Special Character: At least one special character (e.g., @, #, $).
Language settings in PMI
PMI supports a limited number of interface languages. To change your display language:
- Go to Settings → select your Default Property.
- Under User Information, locate the Language dropdown.
- Choose from the available options: English UK, English US, German, Norwegian, Danish, or Swedish.
- Save your settings and refresh PMI for changes to take effect.
However, the PIA chat understands and responds in other languages — so if that helps, feel free to ask your questions in your own language even though the interface remains in one of the supported languages.
Adding a New Hotel / Chain in PMI R&P
Setting up a brand-new property or chain in PMI R&P involves creating secure interfaces, data mappings, and back-end automations. For data-protection and platform-stability reasons this process can only be performed by d2o’s implementation team.
What you can do
- Supply the property’s fact sheet, PMS/POS interfaces, time-keeping details, and go-live timeline.
What we must do for you
- Create the tenant and profit-center structure.
- Configure data integrations & mappings
- Activate licensing & user roles.
- Run QA and hand-over training.
Need a new hotel or chain activated?
Just email support@d2o.com (or open a Freshdesk ticket) with the property name, brand/chain, target start date, and a contact person. We’ll coordinate the remaining steps.
Because of audit and data-security policies, customer administrators cannot add new hotels or chains directly in PMI.
How do I remove an account in PMI Planning?
Important: Accounts that already hold any data (actuals, budget, forecast) cannot be deleted outright. In PMI we de-activate them so they no longer appear in reports or input screens.
Step-by-step (de-activating an account)
- Open the Accounts tool: Planning ▸ Profit & Loss ▸ click the spanner / tools icon ▸ Accounts.
- Show everything: Tick Show all (top-right) so inactive rows are visible and the page loads every account.
- Find the account: Use the search box; you can type the account number or part of the name.
- Untick the “Active” checkbox. In the right-hand column you’ll see a tick for each active account.
- Untick it to de-activate.
- If the box is greyed out, the account is locked by Period Locking or you lack rights – ask your administrator.
- Save: Click the save button. The row turns grey; the account will disappear from input screens after a refresh.
What if the account still shows up?
- Period is locked – unlock it in Advanced Settings ▸ Period locking, then repeat the steps.
- Mapped in a cockpit driver – remove that mapping first.
- Hierarchy override – the account may be forced on by HQ settings; only chain admins can deactivate it.
That’s all: use the Accounts tool, untick Active, save – the line is now hidden from everyday use while all historic data remains intact.
How to create a chain-level report in Planning
When you build a report in Planning → Report setup, PMI lets you decide who can see and run it.
The key setting is the owner / scope of the report.
1. Create the report as usual
- Go to PMI Planning → Report setup.
- Click New report (or open an existing draft).
- Design the layout, filters, and KPIs you need.
2. Set the report’s scope to the whole chain
At the bottom (or in the side panel, depending on version) you’ll find a field called Owner, For, or Hierarchy selector.
- Select the chain name – not a single property. This makes the template visible to every hotel that belongs to the chain.
If you leave the owner on a property, only that property will see the template.
3. Save & publish
- Click Save.
- Confirm the report now appears in the Report list for every property in the chain (they may need to refresh the page).
4. Tell each hotel how to use it
- Ask every property to open Planning → Reports, pick the new template, and run it for the month that just closed.
- They then click Submit / Lock (or whatever your normal version-submission button is).
- Head-office can collect all submissions with Approve several or by exporting the chain-level report.
That’s it: set the scope to Chain → save → each hotel can run and submit the same standard report every month.
Quick-reference: spotting trouble before it hurts the bottom-line
For General Managers (GM)
Focus on these three tiles or views every morning
1. GM Daily Digest ▸ “Key insights” panel
- Any insight highlighted in red = the biggest money leak today (labour over-run, food-cost spike, revenue gap). → Ping the relevant HOD and ask: “Have you saved the latest cockpit? What is the fix?”
2. Home ▸ Labor-cockpit status tiles
- Red = more hours used than forecast → over-staffing / poor planning.
- Amber = cockpit not saved → plan not yet committed. → Request the department to update and save before end-of-day.
3. Management Perspective ▸ RevPOLU bar
- A downward trend or a value below target shows revenue is not keeping pace with paid hours. → Check which department’s hours drove the drop; approve only critical overtime.
For Revenue Managers (RM)
Daily routine to prevent last-minute staffing shocks
1. Rooms Live Forecast ▸ OTB vs Forecast graph
- Gap larger than ±5 % on high-demand dates = risk of revenue or labour miss. → Adjust price / inventory and alert Front-Office to re-staff peaks.
2. Pickup Statistics (next 30 days)
- Sudden pick-up or wash-out = early warning. → Mail updated OTB to HODs so schedules stay aligned.
3. Management Perspective ▸ Room-Revenue row
- Forecast running below Budget or Last Year = price / mix issue. → Re-price low-ADR segments or push higher-rated business.
For Department Heads (HOD)
Fast checks to keep your bar green
1. Department Cockpit graph
- Blue bar above orange “SMART target” line = too many hours today. → Re-deploy flex staff or cut OT.
2. Hours MTD table inside the cockpit
- Amber row = the day hasn’t been saved. → Click Save and Send to Forecast to lock it in.
3. Productivity mini-tile (Home or GM Digest)
- Value below target = output per hour is low. → Review task list and pacing for the shift.
4. Schedule Horizon
- Empty days ahead = no staff planned. → Import / copy the next week’s schedule before the weekend.
What not to chase
- Integration-status and Data-source tiles look alarming but only matter when data is missing.
- If all tiles above are green, the team is on track – move on to guest service.
Keeping these quick checks in the daily routine protects labour productivity and revenue without jeopardising guest experience.
What does “Display per unit” do in the percent block?
The "Display per unit" checkbox in the Percent block changes how percentages are calculated and shown. Instead of calculating percentages based on total values, it shows them relative to each operational unit — like per room night, guest, or cover.
Use "Display per unit" if you want to:
- Break down a percentage cost by unit (e.g., linen cost per room or food cost per cover)
- Compare costs across departments or properties with different volumes
- Monitor per-unit efficiency, not just total contribution
Example 1: Laundry Cost per Guest Night
- Laundry total cost: $1,200
- Guest nights: 600
- Revenue: $15,000
With Display per unit:
- $1,200 / 600 guest nights = $2 per guest
- $2 / $25 revenue per guest = 8% per unit
Without Display per unit:
- $1,200 / $15,000 = 8% total
Same percentage, but "Display per unit" clarifies it’s tied to per guest night, not overall totals.
Where it appears:
You’ll find this option in the Planning module when editing a line and choosing the Percent value type. It works together with account links and custom lines.
What does “Factor” mean in the value block?
In PMI’s Planning module, the “Factor” option allows you to automatically multiply values from other lines — instead of entering a fixed value or percentage manually. It’s perfect for calculating costs or figures tied to volume or activity levels.
Example 1: Laundry Cost per Guest Night
Let’s say you want to calculate laundry cost in the P&L, and you know your hotel spends $2 per guest night on laundry.
Instead of entering the cost manually:
- Link the “Laundry (guest-related)” line to your Guest Nights account.
- In the Value block, choose “Factor” and enter 2.
Result: If you have 500 guest nights, PMI will show $1,000 for that month (500 × 2).
Example 2: CO₂ Emissions from Electricity
Suppose you want to calculate estimated CO₂ emissions based on your electricity usage. You know each kWh used emits 1.5 kg of CO₂.
To automate this calculation:
- Link your emissions line to the electricity usage account (e.g., kWh total).
- Set the Factor to 1.5.
Result: If 1,000 kWh are used, PMI will display 1,500 kg CO₂ (1,000 × 1.5).
Summary – Options in the Value Block
- Value – Shows the raw total (e.g., 500 guest nights, 1000 kWh).
- Factor – Multiplies a base value by a fixed number (e.g., 500 × 2).
- Percent – Calculates a percentage (e.g., 10% of revenue).
How to create or customize a report in PMI Planning
In PMI’s Planning module, you can tailor reports to your needs by customizing existing views or creating new ones, provided you have the appropriate user rights. There are two main ways to get report-style outputs.
1. Customize a View in the Accounts Page (most common)
If you are in Planning → Profit & Loss → Accounts, you can:
- Use the filters and dropdowns to select version (Budget, Forecast, Actual), period (Month, YTD), and department.
- Toggle checkboxes for deviation, percentage, or accumulated view.
- Add or remove columns using the pencil icon.
- Click the Export icon to download the report to Excel.
This method is most common and what users often mean when they say “create a report.”
2. Use the Reports Section (if enabled for your property)
If your property has access to the Reports section in the top menu:
- You can customize and save reports with more structure.
- Set default filters, select comparison versions, and share report views with others.
- If integrated with Profitbase (PMI plus), those reports will also show here.
Important Notes:
- If you don’t see the Reports menu, you can still build effective reports directly in the Accounts view by filtering and customizing.
- Reports are not saved by default — but your filtered view can be exported any time.
Can I add a new account without downloading and uploading an Excel file?
Only sub-accounts can be added manually within PMI. If you’re trying to add a completely new account (i.e., not under an existing account), this must be done using the Excel upload template.
To Add a Sub-Account (no file needed):
You can add a sub-account in Planning → Profit & Loss → Accounts:
- Switch to Edit View (gear icon top-right must be active).
- Locate a parent account that is not connected to a source.
- Click the ”+” icon next to it.
- Enter the sub-account details and save.
Sub-accounts are useful for categorizing internal details under one summary account. The totals will be rolled up to the main account.
Important Notes:
- If the parent account is connected to a source, you will need to remove the connection first to unlock the “+” icon.
- If you’re missing the Edit View or “+” icon, check your permissions, view settings, or module activation.
- New standalone accounts (not sub-accounts) must be added via the Excel template upload.
Why “Live forecast” appears instead of “Actuals” in P&L at month start
In the Planning Module Settings, each chain or property can define an Actual Date Delay Offset. This determines how many days PMI waits after month-end before switching from “Live Forecast” to “Actuals” in the P&L view.
Example scenario:
- For a chain/property, Actual Date Delay Offset is set to 7 (could be any number like 2,3 or 5 etc.).
- If the “Use HQ Actual Delay Offset” box is checked, then that means this property follows the HQ-defined delay.
- With this setting, Actuals are not shown in the P&L until the 8th day of the new month.
- Until then, the heading will display “Live Forecast”, not “Actuals,” to indicate that actual data is not yet considered final or imported.
Why This Happens:
This delay gives time for all necessary actuals (labor hours, revenue, etc.) to be finalized and imported before switching the P&L view from forecast-based to actual-based.
Accessing video playlists and tutorials in PMI
Users can find in-app help and video guides in several places within the PMI platform:
In Each Module (PMI view)
- Look for the video icon beside the property name in the top bar. Clicking this opens a relevant tutorial playlist for that specific view (Module).
Knowledge Base Blade
- Available from the side menu, the Knowledge Base blade includes both:
- Articles with step-by-step instructions.
- A curated video list covering common tasks, including mapping and data uploads.
PIA Chat Welcome Message
- The first-time message from PIA Chat includes:
- A link to video tutorials.
- A button to open the Knowledge Base blade directly.
Recommended routine for ensuring end-to-end data integrity
To maintain accurate reporting and data consistency across PMI modules, validate data at the point of entry—not in the reporting tools.
Daily Checks – Validate at the Source:
- Labor Hours → Confirm yesterday’s hours are saved and correct in the Timesheet cockpit.
- Revenue → Cross-check revenue figures in the Flash Report or Mapping, where revenue is imported and categorized.
- OTB Forecast → Verify pickup and OTB data in the Live Forecast, ensuring recent bookings are reflected.
Weekly Spot Checks – Catch Issues Early:
- Management Perspective & Daily Digest → Use these to identify potential gaps, but not for validation. If something seems off, trace it back to the source module for correction.
How to verify that re‑allocated hours are not double-counted or missing in benchmarking?
Benchmarking reports do not pull data directly from schedules or timesheets, but rely on the saved data in each department’s cockpit. If hours are re-allocated from one department to another, or shared across multiple properties, head-office users should follow these steps to ensure the accuracy:
✅ Step 1: Validate Hours in the Original Cockpit
- Open the cockpit for each property and check the department from which hours were re-allocated.
- If the cockpit has a red background, this means the latest data (including any hour re-allocation) has not been saved — and will not appear in benchmarking.
- Ensure hours are saved and locked in both the source and target departments.
✅ Step 2: Confirm Where Hours Are Booked
- Re-allocated hours must only appear once. Check that the hours have not been duplicated by being entered in both the original and receiving departments.
- If hours are manually adjusted, verify that the adjustment has been made only in one location.
✅ Step 3: Use Consolidated Views for Group Validation (optional, if enabled)
- In Management Perspective > Consolidated View, you can group properties and compare hours by department type.
- This can help identify if a department seems unusually high or low — a clue that hours may be missing or double-counted.
🚫 Do not use Benchmarking as the validation source
Benchmarking does not show re-allocation logic or source-level details. It simply displays the saved result — so discrepancies must be investigated at the departmental cockpit level, not in the benchmark output.
How does PMI handle departments with zero historical data when calculating SMART-schedule guidance
If a department has no historical data, PMI cannot use its SMART algorithms, which rely on past patterns to suggest efficient staffing levels.
Instead, PMI falls back on cost driver logic as the primary basis for scheduling guidance:
Here’s how it works:
- Cost Driver-Based Scheduling: The system uses a linked cost driver (e.g., room nights, covers, revenue) to estimate required hours. This provides a baseline forecast tied to expected business volume.
- Default Productivity Values: PMI may apply default productivity ratios (e.g., hours per 100 room nights) if defined in the configuration or mappings.
- Manual Inputs & Adjustments: Users can manually enter forecasted hours based on expected needs, and these can later be refined as actual data becomes available.
- No ML or Smart Hours Yet: Since Smart-schedule guidance depends on past performance trends, departments with no prior year’s hours won’t benefit from it until a baseline has been established.
Tip: If you’re setting up SMART for a new department, ensure a cost driver is assigned and mapped. This allows the system to provide at least basic forecasting support until historical data builds up.
How can I tell if last-year hours are missing or showing under the wrong department in the Timesheet report?
The Timesheet report doesn’t flag issues directly, but there are a few on-screen cues that can help you identify if something’s off — particularly when viewing last-year hours.
Visual Cues & Hover Tooltips
- Hover over a cell in the Months or Year view: A tooltip popup will appear showing the breakdown, including last-year hours (if available).
- If the tooltip is missing data or shows unexpected zeros, it may mean:
- Hours weren’t saved in the source system (e.g., Cockpit)
- Hours were uploaded incorrectly
- Or they’re being aggregated to the wrong department
Discrepancies Between Timesheet and Cockpit
- If the Timesheet total doesn’t match what’s in the Cockpit for a given date or department:
- It often means the Cockpit wasn’t saved for that day.
- Unsaved hours won’t flow into the Timesheet report.
- Tip: Look for red backgrounds in Cockpit views — these indicate unsaved data.
What You Won’t See
- There are no banners, red warnings, or system errors in the Timesheet itself to tell you something is wrong.
- It’s up to you to use the tooltip hover, manual cross-checking, and the source system data (Cockpit/Schedule or import files) to validate last-year hours.
How are hours synchronized between Schedule, Cockpit, Management perspective, and Benchmarking?
The hours displayed in Schedule, Cockpit, Management perspective, and Benchmarking are always synchronized.
Changes made in the Schedule are automatically reflected across all views. Saving the Cockpit is no longer required for Management perspective or Benchmarking to display the latest scheduled hours.
When comparing values between these views, ensure that you are viewing the same date range.
How to enter hours for last year in PMI
If you need to add or adjust historical hours in PMI (e.g. for last year), manual entry is not done in Budget & Forecast. Instead, you can use one of these two methods:
Option 1: Upload hours via template (recommended)
- Go to Administration > Data Upload Centre.
- Click on Download Templates.
- Select and download the hours upload template.
- Fill in the template with your data (make sure to use the correct year and department codes).
- 'Go to Import Files and upload your completed template.
- Map the fields correctly, validate, and resolve any errors.
- Click Update PMI to apply the changes.
Note: If the period is locked, it must be unlocked first via Advanced Settings > Period Locking. Only d2o or designated admins can unlock past periods.
Option 2: Manual entry in Cockpit (if allowed)
- Navigate to the Cockpit for the department in question.
- Use the date selector to switch to the previous year.
- If editable, enter the hours directly in the relevant rows.
- Save your changes.
Manual entry for historical hours is only possible if the period is unlocked and your role has the appropriate permissions.
How can I manually enter hours for last year?
You can manually enter last year’s hours in the Timesheet Cockpit by clicking the pencil icon next to the relevant day and department. This is useful when historical data is missing or needs adjustment for benchmarking purposes.
Steps:
- Go to the Timesheet Cockpit.
- Navigate to the correct department and date.
- Click the pencil icon to edit hours.
- Enter the value and click Save.
Important:
- Ensure the hours you enter are accurate and reflect actual staffing for the given date.
- If you are benchmarking or reprocessing historical productivity, make sure the correct cost drivers are in place.
Note on Timekeeping Integration:
If you are using an external timekeeping system, hours should only be added manually in PMI if they cannot be entered in the source system. Examples include outsourced staff or call-in employees that are not recorded in the timekeeping system.
How to copy and paste a formula in the P&L Source definition tool
If you’re trying to reuse a formula from one account in another (e.g., from “Kitchen – Paid Holidays” to “Steward – Paid Holidays”), here’s how the paste function works in the Source Definition popup in PMI Planning:
Step-by-step
1. Open the account with the formula you want to copy from
- Click the calculator icon next to the line (e.g., “Kitchen – Paid Holidays”).
- The full formula setup will appear.
- Click the clipboard icon (top right of the formula popup) to copy the formula.
2. Open the target account
- Navigate to the account you want to apply the formula to (e.g., “Steward – Paid Holidays”).
- Click its calculator icon to open the Source Definition.
- Now, the clipboard icon (paste button) in the new window should be active.
- Click it to paste the copied formula.
3. Review and Save
- Review the pasted formula and adjust department/category mappings if needed.
- Click Save/Update to apply the formula to the new line.
Troubleshooting
- The Paste icon will only activate if a valid formula has already been copied during the session.
- If it appears inactive, go back and re-copy the formula from the original line.
- Advanced/Secured checkboxes: Ensure the right options are selected based on how the formula was originally configured.
- The feature works within the same browser session—reloading the page or logging out may reset the clipboard.
Why is PMI showing hours instead of FTE in Budget (Target) & forecast?
If you’ve selected FTE in the Budget & Forecast module but the system still shows Hours under productivity, here’s what to check:
Possible Reasons:
- FTEs are centrally managed: In some cases, FTE values are uploaded or controlled by a central team (e.g., head office), which overrides local FTE input and forces the view to show hours.
- Toggle was not applied correctly: Double-check that the FTE toggle is selected. If needed, refresh the view after toggling.
- Permissions or configuration: Some user roles or property setups may not allow FTE input locally. Instead, the interface defaults to hours.
What to do:
- Confirm that the FTE toggle is selected.
- Try refreshing the page after changing the toggle.
- If it still shows hours, check internally if your FTEs are managed centrally.
- If unclear, contact your administrator or controller for confirmation.
Missing OTB data for a specific department
If you’re missing OTB (On The Books) data for a department in PMI (like Breakfast for example), here’s what to check:
Step 1: Check OTB Interface Mapping
Even if revenue mapping exists (e.g., for Breakfast under StayNTouch Rover_Revenue), OTB requires its own mapping.
- Go to Mapping > Accounts.
- Switch interface to StayNTouch Rover_OTB (or the relevant OTB interface).
- Verify that Breakfast is listed and mapped to the correct PMI Profit Center.
- If it’s missing, that’s the issue — this department’s OTB data isn’t flowing in.
Fix: Create the missing mapping under StayNTouch Rover_OTB and assign it to the “Breakfast” PMI Profit Center.
Common Mistake
Chains may have revenue interfaces set up without enabling OTB mappings for all departments. This is often the reason OTB is missing for specific cost centers.
FTE looks incorrect — what to check
If your FTE looks too high, here’s what to check:
- Wrong row selected: Make sure you’re reading the correct FTE row. Some rows include non-productive hours (e.g., sick leave, training), which inflate the total.
- Standard hours mismatch: In Advanced Settings, confirm the working month setup. For example: 23 days × 8 hours = 184 hrs per person → 368 hrs for 2 people = 2.0 FTE.
- Min/Max hours configured?: Some departments have minimum or maximum hour constraints that influence calculations. Check if these are active.
Tip: Use the calculator icon next to the value to view how the FTE is being calculated.
If the hours look right but the FTE doesn’t match expectations, it’s often just the wrong table row being referenced.
How to tell if a forecast for future months has been submitted
PMI does not send automatic alerts for missing forecasts, but you can check the submission or status in two different modules depending on how your property is configured:
Option 1: PMI P&L (Planning) – Recommended Method
This is the formal submission process where forecasts are actually locked and reviewed.
Steps:
- Navigate to: Planning → Profit & Loss → Tools → Status
- Select Property and Period (e.g., next 1–3 months).
- At the top, switch to “Forecast” (not Budget or Actual).
- Scroll down to view Profit Centre statuses.
Statuses explained:
- Live = Forecast values exist but not yet submitted.
- Ready = Submitted by the department but not locked.
- Locked = Submitted and finalized (no further editing).
- Rejected = Returned to department for correction.
Approval Status (optional):
Some properties have approval workflows. If enabled, you’ll also see:
- Pending, Reviewing, Approved, or Rejected by management.
This is the most reliable way to confirm if forecasts have been submitted and finalized.
Option 2: PMI R&P (Live Forecast)
This is often used for setting forecasts, but it does not have a submission workflow like P&L.
Steps to Review:
- Go to Live Forecast
- Click the Tools icon → Submit from Live Forecast
- Choose period: Next three months or a custom range
- Review values
- Click Submit to push values to the Forecast version
Note: This action copies values but does not change the status to “Ready” or “Locked.” For that, you must use Planning Status Tool (Option 1).
How to confirm if P&L accounts are pulling the correct data
To quickly check if the revenue shown in your P&L report matches what’s in the Accounts view, and to confirm where the data is coming from (e.g., Budget, Forecast, or Live values), follow these steps:
Step 1: Compare Totals
- Open the P&L report and note the total revenue.
- Then go to Planning → P&L → Accounts for the same period.
- Use the filter to show only Revenue accounts to simplify the view.
- Check that the totals match. If they do — you’re good to go ✅
Step 2: Check Where Each Account Pulls Data From
To understand exactly which source (Budget, Forecast, etc.) a revenue account is using:
- Still in Planning → P&L → Accounts, find the account in question.
- Click the calculator icon next to the account name.
- A pop-up labeled Source Definition will appear. This shows which dataset PMI is using — such as:
- Hotel name → Room Revenue (Forecast)
- Hotel name → Food Revenue (Budget)
This is especially useful if your setup includes manual overrides, custom mappings, or multiple data sources.
Step 3: If Totals Still Don’t Match
- Check account mappings: Go to Mapping → Accounts and confirm each account is correctly assigned.
- Look for split accounts: If one account feeds multiple departments, make sure the splits are correct.
- Use the Import Status module to check if all expected revenue has been pulled in.
- Use Flash Report: Hover over revenue figures to view the underlying data imported from your PMS/POS.
How to activate deactivated accounts in Planning
If you want to reactivate accounts in the Planning module (e.g., accounts that were previously removed from view), follow these steps:
Step-by-Step Instructions
Go to the Accounts View
- Navigate to PMI Planning → Profit & Loss → Accounts.
- Make sure you’re in the Edit View (gear icon must be enabled, not grayed out).
Enable ‘Show All’
- Tick the box “Show All” to display both active and deactivated accounts.
- This will also reveal rows that are grayed out or hidden.
- Ensure the correct department is selected (to avoid delays).
Locate the Deactivated Account
- Use the search box to type in the account number or name.
- You can filter multiple accounts by separating them with commas (e.g., 4101, 4305).
Re-Activate the Account
- Once found, locate the checkbox next to the account row — this enables/reactivates it.
- Note: You can’t “click” the row like a form — you must tick the checkbox to reactivate.
Save Your Changes
- Click the save button
- Once saved, the account will be active and visible in forecasts or budget input.
Tip: If you still don’t see the account or it won’t activate:
- Make sure the account isn’t locked via period locking or hierarchy settings.
- You may need admin rights to reactivate accounts across departments.
Productivity based hours
These are typically used for operational departments where productivity is the main target. When the cost driver (e.g., room nights, revenue) changes, PMI automatically recalculates the required hours to maintain the fixed productivity target. This keeps your labor plan aligned with real activity levels.
What to do:
- Go to PMI cockpit → Select your department
- Click the gear icon to access settings
- Under the Forecast settings, ensure the “Productivity is locked” option is enabled
- Save changes to apply productivity-based forecasting
For example, if more rooms need cleaning next month, the Housekeeping department will automatically receive more hours to meet the productivity target (e.g., 0.25 HRS/RN).
How do I validate that the revenue in my P&L report matches the revenue in my accounts view?
To quickly check if the revenue in your P&L report matches the Accounts view, follow these simple steps:
Step 1: Compare Totals
- Go to the P&L Report and note the total revenue.
- Then open the Accounts view for the same period.
- Use the filter to only show Revenue accounts — this simplifies the comparison.
- Check if the total matches the revenue shown in your P&L report.
Tip: Click the calculator icon next to any account in the Accounts view to open the Source Definition. This will show you exactly which department or source system the data is pulled from — great for spotting mismatches.
If everything adds up, you’re all set ✅
Step 2: If Totals Don’t Match
- Check account mappings: Go to Mapping → Accounts and confirm each account is assigned to the correct department/category.
- Look for split accounts: If one account is shared across multiple departments, check the split percentages in the mapping tool.
- Verify imported data: Use the Import Status module to confirm all expected revenue has been imported into PMI.
- Cross-check via Flash Report: over over figures in the Flash Report to see the raw data pulled from PMS/POS systems. Compare with what’s in the accounts view.

How to check which Add-On modules you have enabled in PMI
If you’re unsure whether certain PMI modules are enabled for your property or user role, the easiest way to check is by looking at your main menu navigation inside PMI.
What to Look For:
Modules will show as menu items in the left sidebar or in the top navigation menu when you click the main menu (hamburger icon). Here’s what each enabled module looks like:
- PMI R&P: Always visible, includes Cockpit, Schedule, Live Forecast, etc.
- PMI P&L (Planning): Appears as "Profit & Loss" under "PMI Planning."
- GoGreen: Shows as "GoGreen" in the side menu, including "Home," "Cockpit," and "Task Bank."
- PMI Plus: Found under PMI Planning with features like "PMI+ Target" and "PMI+ Finance Reports."
- CoE Analytics – R&P: Located at the bottom of the main menu as "CoE analytics suite – R&P."
- CoE Analytics – F&B: Listed as "CoE analytics suite – F&B."
- Quick Menu Icons: The left-hand quick menu also displays icons for GoGreen and P&L if they are active, making them easy to spot without opening the full menu.
Navigating to GoGreen in PMI
GoGreen helps you track and manage sustainability data across departments. If you’re unsure which menu to use or where to find specific views like HoD comments — this article is for you.
How to Open GoGreen
From the main left-side menu, click GoGreen.
This opens a sub-menu with three options:
1. Home – the main dashboard
- Shows all cockpits as tiles (Water, Energy, Food Waste, etc.)
- Ideal for switching between departments
- Lets you click into any cockpit, even if you haven’t visited it recently
2. Cockpit – direct access to last visited cockpit
- Takes you to your most recently viewed GoGreen cockpit
- If you last reviewed “Food Waste,” this option brings you right back there
- Use this for quick daily follow-up
3. Task Bank – manage action plans
- View or assign tasks related to GoGreen targets
- Often used for following up on over-consumption or initiatives
Where to view all comments from HoDs in cockpits
- Navigate to the specific department’s cockpit (e.g., Housekeeping, Restaurant).
- Look for the comment icon or text field associated with each day to read the HoD’s input.
- Some comments, especially those related to performance explanations, may be transferred to the Flash Report.
- Review the Flash Report for any summarized comments or notes.
- Navigate to the GoGreen Cockpit via the PMI home page.
- Select the desired resource type and date.
- Review the comments under the progress bars, for each resource category, for insights from HoDs.
How to add staff to a department in the PMI (Manual entry vs Scheduled workflow)
There are two ways to register staff and calculate personnel costs in PMI, depending on the department setup.
1. Manual Staff Entry (Fixed Cost or Non-Scheduled Departments)
Use this if you’re adding staff in departments like Admin, Maintenance, or any area not driven by schedules.
Steps:
- Go to the P&L module, and select the relevant department.
- Choose the “Staff” view at the top.
- Hover over the department row and click the edit icon.
- Select “Add Staff” and fill in title, rate, hours, etc.
- Click Save.
Use this method when the department doesn’t use PMI R&P scheduling for staffing.
2. Dynamic Forecasted Staff Costs (Schedule-Driven Departments)
Used for departments like Housekeeping or Restaurant, where staffing is based on actual schedules.
Steps:
- Go to PMI R&P > Schedule and input staff shifts.
- Save and Send to Forecast (this pushes data to Planning).
- In PMI Planning > P&L, choose Staff view and ensure version is set to Forecast.
- Rates and hours will calculate automatically based on the sent schedule.
If the table is empty, check that schedules have been saved and sent to Forecast.
Why are my SMART hours a straight line?
If your SMART forecast displays a flat line—such as 3 hours per day—it typically indicates that the system is constrained by specific settings, preventing dynamic adjustments based on activity levels.
Primary Cause: Min/Max Settings
The most common reason for this issue is that the minimum and maximum hours in the SMART configuration are set to the same value. This setup restricts SMART from adjusting hours in response to fluctuations in demand or activity.
How to Check and Adjust Min/Max Settings
- Navigate to the Cockpit:
- Open the relevant department’s Cockpit in PMI.
- Access Tools and Settings:
- Click on the Tools and Settings icon (usually represented by a gear or wrench symbol).
- Review Min/Max Hours:
- Locate the Min/Max Hours section.
- Check if the Minimum and Maximum hours are set to the same value (e.g., both at 3 hours).
- Adjust Values:
- If both values are identical, modify them to allow flexibility. For example:
- Set Minimum Hours to 2.
- Set Maximum Hours to 5.
- This range enables SMART to allocate hours dynamically based on actual demand.
- Save Changes:
- After adjusting, ensure you save the changes to apply the new settings.
Additional Considerations
- User Permissions: Ensure you have the necessary permissions to modify Min/Max settings. If not, contact your system administrator.
- Historical Data: If SMART lacks sufficient historical data, it may default to static values. In such cases, consider manually adjusting the forecast or consulting with your administrator.
- Cost Driver Accuracy: Verify that your primary cost drivers are accurately forecasted. Inaccurate inputs can affect SMART’s calculations.
Why can’t I edit the forecast for a closed or previous period?
In PMI, forecast periods like May can become locked after a certain point to protect finalized data. If you have the right role (e.g. Operational Manager, Controller), but still can’t edit, it’s likely due to Period locking being active.
What to do:
Check Period Locking:
- Go to Advanced settings > Period locking
- Look for a padlock icon next to May.
- If it’s locked, click to unlock — this will open the period for editing.
Still can’t unlock it?
- You may have edit rights, but not access to Advanced Settings.
- In that case, ask your administrator or HQ finance contact to unlock it for you.
Once unlocked, you can go back to your module (Cockpit, Forecast, etc.) and make the changes you need.
I can’t enter the closing value for food inventory
In PMI, the Closing inventory value for one month automatically becomes the Opening inventory value for the following month. If the field appears locked or non-editable, here’s what to check:
Possible Reasons & What to Do:
1. The period is locked
- Once a month has ended, PMI treats it as finalized (actuals). Fields like Closing inventory are locked to protect reporting accuracy.
- Solution: Ask your administrator to unlock the period using Period locking (found under Advanced Settings). Once unlocked, you’ll be able to enter or adjust the value.
2. You don’t have editing rights
- While most F&B Managers or Controllers do have access, some user roles might be restricted from editing actuals.
- Solution: If you’re unable to edit even after the period is unlocked, contact your local admin or support team for assistance.
Tip: Always save after making edits, and verify that the Opening inventory for the next month reflects your updated value.
Why can’t I edit rates for a past month?
Issue: You’re trying to change rates (or other values like hours, productivity, or labor costs) for a past month in PMI—like April—but the fields are locked and uneditable.
Why It Happens
PMI automatically locks all historical data to preserve reporting accuracy. Once a month ends, the system treats that data as actuals, not forecasts. This affects all modules, including the Cockpit and Budget & Forecast.
What to Do
You’ll need to unlock the period using Period locking:
- Go to Advanced settings → Period locking
- Find the padlock icon for the relevant month (e.g., April)
- Click it to unlock the period
Once unlocked, all related values for that period become editable across the system.
Important Notes
- Only users with elevated rights (like Admins or Revenue managers) can unlock past periods
- If you don’t have access, contact your PMI administrator
- Treat unlocked periods with care—editing actuals should always be intentional and documented

Scroll bar not working on Mac (but works on PC)
Issue: You’re unable to scroll or see the scroll bar when using PMI on a Mac, although it works fine on a PC.
Likely Cause: This is almost always due to a macOS trackpad or mouse setting that hides or disables the scroll bar.
What to Do:
- Go to: System Settings → Appearance (older macOS: System Preferences → General)
- Check Scroll Bar Settings. Look for the setting: Show scroll bars and choose: “Always”
- Restart your browser and try again in PMI.
Tip: PMI is fully compatible with Mac, and this issue is not caused by browser type or software bugs. Once scroll bars are set to “Always show,” the issue is typically resolved across all PMI views.
Why are my KPI values different in Benchmarking vs Management perspective?
Issue: You’re seeing different values for the same KPIs when comparing the Benchmarking module and the Management Perspective.
Likely Causes & Quick Fixes:
Benchmarking data may be delayed
- Benchmarking updates less frequently than other modules.
- It can take up to 2 hours to reflect changes made in Management Perspective or Forecasts.
- What to do: Wait 1–2 hours, then refresh to check for updates.
Currency mismatch
- Benchmarking allows switching display currency (EUR, USD, etc.).
- If it’s different from your property’s default, values may appear inconsistent.
- What to do: Go to View options in Benchmarking and match the property’s currency setting.
Different KPI baselines (a.k.a. “measuring points”)
Even if data is up to date and currencies match, KPI scores can differ due to how they’re calculated:
- Benchmarking KPIs are measured against the static Forecast and Last Year’s actuals
- Management Perspective KPIs use the SMART Forecast and SMART Last Year values — these reflect live business dynamics and cost driver changes
Even if actuals are identical, the baselines used will shift the KPI percentage.
Reminder: Both modules pull from the same underlying data — differences in score are intentional and context-driven, not data errors.
How often is data updated in Portfolio perspective?
The Portfolio Perspective reflects submitted and locked forecasts, along with imported actuals. It does not follow the predictive refresh intervals used in Live forecast modules.
Portfolio Perspective Update Schedule
PMI updates Portfolio data based on two schedules:
Hourly updates covers:
- Last month
- Current month
- Next month
Ensures near real-time visibility for the most relevant periods.
Daily update (at midnight, 02:00) covers:
- Last year
- Current year
- Next year
Applies to longer-term reporting and year-on-year comparisons.
Note:
- Data appears in Portfolio as soon as it is submitted or locked
- Actuals are included once imported and processed
- This view does not rely on predictive recalculations, unlike SMART or Rooms Live Forecast
How to handle temporary room closures (due to renovation) in PMI
If some rooms are temporarily closed due to renovation, you can adjust your forecasts in PMI to ensure productivity and cost-driver metrics remain accurate.
1. Adjust Cost Drivers in the Forecast: To reflect reduced room availability:
- Go to the Revenue forecast view (under Live Forecast)
- Select the affected period (e.g. renovation month)
- In the Room nights or Available rooms field, enter the reduced number of rooms for the affected dates
- Save your changes
These changes will immediately update your Live forecast and influence related cost drivers in labor cockpits.
2. Resubmit the Forecast
After adjusting room counts:
- Click Submit in the Forecast view
- This ensures that the adjusted forecast becomes the basis for calculations in Cockpits and P&L
3. Check SMART Hours
If SMART scheduling is used:
- Navigate to the Labor cockpit
- Verify that SMART hours have adapted to the new room volumes
- Use Sense check or the visual graph to confirm no unrealistic spikes or dips remain
How to check if forecasts have been submitted for the next 3 months
If you want to confirm whether all hotels have submitted their forecasts for the next three months, the steps depend on your access level.
If you have access to the Planning module:
- Open the Live Forecast module
- Use the Submit Several or Approve Several options under the Tools menu
- The table will show:
- Each property
- Latest forecast submission date
- Status (e.g. Pending, Ready, or Locked)
If you don’t have Planning access:
You can still check forecast status in the P&L Status tool:
- Go to Tools → Status
- Select the property and month range
- Look at the Room Revenue department (typically Reception or FO)
- If the status is Ready or Locked, the forecast has been submitted
For General Managers:
If you only need to check Room Forecast:
(Note: This feature is only available in the current version, not the legacy one)
- Open Rooms Live Forecast
- Switch to Table View
- Scroll through the upcoming three months
- Use Sense Check to spot any missing or unusual data
- Submission status via Go to P&L → Tools → Status to confirm whether the Room Revenue forecast is submitted (Ready/Locked) or still Pending.:
Note: Forecasts are considered submitted when their status changes from Pending to Ready or Locked.<
How to confirm that forecast targets are correctly applied
To ensure forecast targets are properly set and reflected in PMI — whether for a coaching session, planning review, or operational check — follow these quick steps:
Check the Budget & Forecast Module
- Go to Budget & Forecast
- Select the relevant month
- Confirm that productivity targets and hours are entered for all departments
Review the Labor Cockpit
- Navigate to the Labor Cockpit for the same period
- Ensure that SMART hours match your targets
- Look for any red hygiene warnings that indicate missing or outdated inputs
Verify Lock Settings
- In the Cockpit, check whether productivity or hours are locked
- Locked values ensure targets won’t shift if cost drivers change
Confirm with Department Heads (if needed)
- HODs should verify that targets align with real operational needs
Tip: If anything’s missing or needs adjusting, update and save the forecast to apply the changes system-wide.
What happens when forecasts remain at Staffing-guide defaults?
If a department’s forecast isn’t updated and remains at the staffing-guide default beyond the expected deadline, the PMI Adoption Index will indeed display this as a hygiene factor. These hygiene factors are marked in red to draw attention and indicate areas requiring action to maintain data integrity and operational efficiency. However, hygiene factors generally do not directly impact the index score, except for those related to Rooms management, which do affect the score due to their impact on forecasting accurac
Best Practices to Address This:
- Regularly Review the PMI Adoption Index: Monitor for any red-marked hygiene factors indicating unupdated forecasts. 
- Update Forecasts Promptly: Ensure that departmental forecasts are reviewed and updated regularly to reflect current expectations and avoid reliance on default staffing-guide values.
- Utilize the Staffing Guide Effectively: While the staffing guide provides baseline recommendations, it’s essential to adjust forecasts based on real-time data and departmental insights.
By proactively managing forecasts and addressing hygiene factors, departments can ensure accurate staffing levels and maintain optimal operational performance.
Best practice cadence for keeping live forecasts current (for Staff planning)
To ensure your Live Forecast reflects upcoming trade-fair periods — especially for effective staffing — follow this practical cadence:
Monthly Cadence:
Update the Live Forecast early
- Make adjustments to the Live forecast in the Revenue forecast view
- Do this as soon as trade-fair dates or demand changes become clear, ideally before the 20th of the current month
Review key dates for next month
- Scroll to next month in the Revenue Forecast view
- Check if key trade-fair dates are already reflected (volume, rates, etc.)
- If not, manually adjust the forecast for those dates
Monitor how changes affect labor
- Once the Live Forecast is saved, the updated figures feed directly into the Labor cockpits, which use these forecasts to calculate SMART hours
Repeat monthly
- Revisit the forecast by mid-month for the following month
- This rolling review ensures staffing is aligned well in advance
Note: There is no need to “submit the forecast to Cockpits” — once saved, the Live Forecast automatically updates the relevant dashboards and labor planning tools.
Live forecast warning for One-Off events
Issue: Some dates in the Live forecast may show a red warning triangle, indicating that PMI prediction could not generate an automated forecast for that date.
This usually happens when:
• There is insufficient historical data
• Many historical dates for that day have been marked as outliers or excluded
What to Look For:
- A red warning triangle appears next to the date in the Live Forecast
- This icon signals that the system could not generate a forecast
- Hovering always display a text
What to Do:
- Click the triangle or review the flagged date
- Consider whether the activity is linked to a one-off event (e.g., concerts, closures), but keep in mind that if there isn’t enough historical data, this limitation cannot be influenced by the user.
- If PMI cannot generate a forecast for a specific date, enter a manual value to maintain reporting accuracy — but note that manual forecasts do not influence future automated predictions. Only manually added outliers in the season calendar can affect future forecasts.
Related: To learn how PMI Prediction filters out unusual events so they don’t distort future forecasts, see What is an Outlier?”
How to compare TKS hours with hours in PMI
To compare actual worked hours from your Timekeeping System (TKS) with the scheduled/planned hours in PMI, use the Labor Cockpit:
Steps to Check:
- Go to the Labor Cockpit
- Select the relevant department and date range
- Click the plus sign next to the date to expand the daily detail
- You’ll see:
- Scheduled hours (what was planned)
- TKS hours (what was actually worked and imported from your Timekeeping System)
- Hours broken down by productive and non-productive categories
You can also hover over bars in the graph to compare day-by-day totals visually.
Tip:
- If the numbers don’t match, check whether:
- The TKS import has been processed for the current period
- The department and role mappings between TKS and PMI are up to date
- Any manual adjustments were made in TKS or PMI after the import
How to check if schedules match the demand forecast
To make sure your schedules reflect the current demand, do a quick visual check in the Labor Cockpit:
What to Look For:
- Blue bars: Represent scheduled hours.
- Yellow line: Indicates the SMART Forecast, which is system-generated based on targets and cost drivers.
- Green dashed line: Marks the Scheduled Horizon, showing how far ahead scheduling is active
Your scheduled hours (blue bars) should closely follow the yellow SMART Forecast line. If they’re significantly above or below, it may indicate over- or under-scheduling.
Where to Check:
- Go to the Labor Cockpit
- Select the correct department and date range
- Compare the visual graph — especially just beyond the green dashed line
Tip: If the SMART Forecast seems off, click the forecast icon to review the SMART and Management Forecast values.
F&B insights report looks incorrect or empty?
If your F&B insights report looks incorrect, shows missing values, or doesn’t reflect recent activity, try the steps below before escalating. These common checks resolve most display or data issues quickly.
Check Your Filters and Slicers
- Make sure no unexpected filters or slicers are applied.
- Look for filters hidden on side panels or pages.
- Clear all filters and try again if results look off.
Refresh Your Browser
- Sometimes reports don’t load properly on the first try.
- A quick browser refresh (F5 or Ctrl+R) can help.
Make Sure Your Data Is Up to Date
- Look for a “Last refreshed” date/time on the report (often at the top right).
- If the data is old, it may not reflect today’s sales or labor inputs yet.
Check mapping
- Go to Mapping – FB PowerBI in the main menu
- Confirm the relevant departments and revenue accounts are mapped correctly
What Is the Staff module in PMI?
The Staff module is used to manage and maintain the staffing structure for each department, including roles, salary levels, and hourly cost settings.
Key Functions:
- Define staff roles and link them to cost accounts (e.g., Housekeeping Attendant, Receptionist)
- Assign hourly rates or salary levels for each role
- Differentiate between fixed and flexible staff
- Enable salary cost calculations in the P&L module based on scheduled hours
Access:
Only users with the appropriate permissions, such as the “Salary Editor” role, can edit the Staff module. This ensures controlled access to sensitive salary and cost data.
Where it connects:
- Data entered in the Staff module flows into PMI Planning and is used to calculate staff-related costs in Budgets, Forecasts, and Live Forecasts
- It does not control scheduling, shift planning, or productivity forecasts — those are handled in other modules like Cockpit or Forecast
Live forecast shows zero despite formula setup
Issue:
Some accounts in the Live Forecast column show 0 even though formulas exist. This is sometimes seen when:
- The formula appears present but doesn’t calculate
- Other months (e.g., June) work correctly while the current month (e.g., May) doesn’t
Possible Causes:
- Constants set to 0% for the month in question
- Manual override that removed the formula for that month
- Missing or invalid data inputs (sales volume, pricing, etc.)
- Formulas not copied/applied correctly to the affected month
What to Check:
- Open the account in the P&L module (e.g., 3030 or 3031)
- Click the formula icon to view the current calculation setup
- Verify if a constant is applied — and whether it’s 0% for the month
- Check if there is a manual value override instead of a formula
- Compare behavior between working months (e.g., June) and the affected one
Recommendation:
If you’re unsure or need help analyzing the setup:
- Take a screenshot of the formula popup (showing constants and calculation structure)
- Share it with support for a more accurate assessment (This step is especially important when constants are involved.)
Requesting user access in PMI
General access request (non-Radisson users):
Access changes in PMI can only be made by designated system administrators within your organization.
Please contact your internal PMI admin or head office contact to request access.
If you’re unsure who to contact, reach out to your direct manager or regional support team.
Radisson Hotels – Standard procedure
If the request comes from a Radisson property, follow this standard protocol provided by RHG HQ:
“According to RHG HQ, they handle all PMI user-related requests. You’ll need to submit a request through HotelKit.”
How to request PMI access in HotelKit:
- Go to “Tasks”
- Click “Add task” and select Radisson Hotel Group
- Choose “Select template”
- Search for “PMI” and select the template: New PMI user
- Under “Rights needed”, specify the access level required or reference an existing user (e.g., “Same as FO Manager”)
Breaking down RevPAR in PMI: ADR vs. Occupancy
If you notice a drop in RevPAR (Revenue per Available Room) and want to identify whether it's due to ADR softness, lower occupancy, or event timing, PMI provides built-in KPI tiles to help:
- ADR (Average Daily Rate): Reveals pricing trends and helps determine if reduced room rates are driving lower revenue.
- Occupancy Rate: Indicates the percentage of rooms sold, helping you spot drops in demand or booking volume.
- RevPAR: Combines ADR and occupancy to show overall room revenue performance.
These KPIs are pre-configured in the following PMI modules:
- Flash Report: Provides daily revenue insights and month-to-date results.
- Benchmarking: Compares your property’s performance against competitors.
- Portfolio Perspective: Offers a broader view of performance across multiple properties.
Note: Users cannot add or configure their own KPI tiles — these are system-defined views available based on your access level.
To assess event-related impacts, use filters to compare performance across specific dates, weekends, or known event periods.
Accessing Group and Chain view in the adoption index
To access Group view or Chain view in the PMI Adoption Index (or GoGreen index):
- From the Home screen, click the PMI adoption index tile (found in the left-hand menu under PMI R&P)
- Inside the Adoption Index dashboard, look for the View selector in the top-left corner
- Choose between:
- Property View (default)
- Group View
- Chain View
Access control
Group and Chain views are only available to users with the right permissions (e.g., regional managers or head office). If these options aren’t visible, your account may be limited to property-level access
Once selected, the view updates to show performance data at the chosen level, including PMI scores and adoption breakdowns.
Using staffing guide values as temporary productivity targets
Using Staffing Guide Values as Temporary Productivity Targets
To use Staffing Guide values as temporary productivity targets in PMI:
- Go to the Budget & Forecast module
- Manually enter the staffing-guide values for each department and period
- Click Save to apply
Staffing Guide values appear as green lines in the Labor Cockpit and are based on historical data and forecasted activity.
These values offer a realistic fallback until official head-office targets are available.
Fallback value when head-office targets are missing
When head-office targets aren’t yet available, use the Staffing Guide baseline as your fallback value. This baseline is calculated using PMI’s internal logic based on historical data and current cost drivers.
If the Staffing Guide baseline leads to a lower RevPOLU than last year, consider setting a higher productivity target manually to maintain momentum and drive continuous improvement.
SMART schedule not updating?
If your SMART schedule isn’t updating as expected after clicking Save (which causes the Save button to turn grey), here are key steps to verify and resolve the issue:
- Confirm On-Screen Indicators: After saving, check for the green dashed vertical line in the schedule view. This line marks the end of the Scheduled Horizon and confirms that your updated targets have been applied.
- Review Productivity Targets: Unrealistic or outdated productivity targets can cause inaccurate hour forecasts. Review and adjust targets in the Budget & Forecast module in collaboration with department heads to ensure they reflect actual operational goals.
- Inspect Cost Drivers: Make sure the cost drivers used in forecasting are up to date and relevant to current business activity. Mismatched or legacy drivers may lead to poor SMART hour allocations.
- Check Scheduled Horizon Settings: Ensure the Scheduled Horizon is correctly configured. It determines how far into the future the SMART schedule generates hours. Note: This does not affect imported hours from your Timekeeping System (TKS). If data appears missing, review your TKS mapping settings instead.
- Consider Manual Adjustments: If SMART hours consistently differ from expected trends, use the Staffing Guide to manually adjust the schedule. This can help bridge gaps caused by recent staffing pattern changes or unaccounted-for anomalies.
Understanding the Scheduled Horizon and Graph Lines
The Scheduled Horizon in PMI shows how far into the future schedules are active and where PMI’s SMART forecast begins.
In Legacy Tables and Schedule Views:
- Red vertical line = Today
- Dashed green vertical line = Scheduled Horizon
- Beyond the green line, users can manually enter schedules. If left blank, PMI auto-generates SMART hours.
In the Day-to-Day (Labor Graph) View:
- Dotted black vertical line = Today
- Dashed green vertical line = Scheduled Horizon
These visual markers help you compare scheduled hours with PMI’s suggested SMART schedule.
If you don’t see the Scheduled Horizon or Today lines:
- You may not be in the graph (Day-to-Day) view
- You may be viewing past or already finalized periods
- Your user role or cockpit view setup may limit what’s shown
Tip: The Scheduled Horizon is usually set by the Head of Department (HOD) under View Settings — often to a fixed number of days ahead (e.g., 14, 28 or 90). If you don’t see the green line immediately, try using the date picker to advance one month at a time — the Scheduled Horizon may be set further into the future.
How can I change the property name in PMI?
Changing a property name in PMI isn’t something users can do themselves. Property names are tied to the system hierarchy and managed centrally by d2o. If you need to change the name of a property, please contact d2o Support or your PMI administrator. They will make the necessary adjustments on your behalf.
How to activate consolidated views in PMI
Consolidated Views allow you to group properties or brands (e.g., 5-star, regional, or discount chains) and compare their performance across departments.
Step-by-Step Guide
Set Up Productivity Departments (Benchmarking Module)
- Go to Benchmarking in the side menu.
- Activate the Productivity radio button at the top.
- Click Tools → Setup Sources.
- Create a Productivity Department by selecting a name, department types, cost driver, and day offset.
- Click Update and then Refresh.
- Use the Ignore option if you want to exclude specific departments chain-wide.
Activate Consolidated Views (Advanced Settings)
- Go to Advanced Settings in the main menu.
- Users with appropriate access rights — such as Regional or Head Office roles — can activate Consolidated Views.
- Choose the consolidated groupings (e.g., by brand, rating, or region) to make them visible in Management Perspective.
- Save your changes.
Note: Property-level users like General Managers or Financial Controllers can view and use Consolidated Views once activated, but cannot modify these settings.
Activation is typically handled by users at Regional or Head Office level — not by d2o Support.
Access in Management Perspective
- Open the Management Perspective module.
- On the right-hand side below divisions, click on Consolidated Views.
- View aggregated productivity departments alongside regular divisions.
- Hover to see which department types are included.
Why do I not have any index?
The Index — formerly called the PMI Index and now officially known as the PMI Adoption Index—measures how effectively a property or department uses PMI to manage resources and improve productivity. A score of 8.0 is good, and 8.5 or above is considered excellent.
Common Issues and what to do:
- Score Not Updating? The index recalculates automatically every night after midnight CET. → If you’ve made changes or improvements, check back the next day to see if the score has been updated.
- Score Seems Low? Use the Index Dashboard to drill down by department. → Focus on areas with either low scores or high weighting — that’s where your improvements will have the biggest impact.
- Confused by the Weighting? Not all departments are treated equally in the score. → The index is weighted based on department size, revenue, and hours worked — so larger departments influence the overall score more.
Index not showing?
- Access rights: You might not have permission at the current view level.
- Missing data: Hours, revenue, or plans may be incomplete or missing.
- Recent changes: Wait until after midnight CET for updates to apply.
- Wrong view: Ensure you’re at a department, property, or chain level where the index is calculated.
- System issue: If none of the above applies, contact support for help.
Mapping a demo site in PMI
The Mapping Demo is the first step when preparing an anonymous demo site with fictitious departments and property names. It’s accessible under Global settings > Mapping Demo in PMI.
Note: this feature is available only to d2o employees
What’s it for?
Use Mapping Demo to create a deployable demo site based on existing chain databases. This is great for demos or training purposes where real data should be anonymized.
Quick Steps to Set Up
- Navigate to Mapping Demo (Global Settings).
- Click “Initiate Demo Instance” to create a new demo based on an existing template.
- Select a template from the dropdown. If none exist, create one:
- Choose a chain
- Select properties
- Click Save
- Name your template
- Pick an expiration date (calendar icon).
- Once both template and date are set, the Initiate button becomes blue. Click it to start.
Good to Know
- Only one active demo per chain is allowed.
- Templates must be edited (target names changed) before saving or initiating.
- Use the pencil icon to rename fields. Red alert = required changes.
- Demo expires on the date you select, but can be updated or deleted by the owner.
Manually link Forecast revenue from R&P to Planning
To manually link forecast revenue from the Revenue & Productivity (R&P) module to the Planning module in PMI:
- Go to the P&L module → Accounts.
- Select the account you want to link (e.g., Room Revenue).
- Under Source Definition, choose the source data, such as: Hotel Name → Room Revenue (Forecast)
- Save your changes.
This method gives you full control and allows you to override automatic data flows or pull data from specific departments as needed.
Note: While this process is not always shown step-by-step in the Knowledge base, it aligns with how account source definitions work in PMI.
How to reference previous Mapping settings in the Mapping accounts view
If you want to use previous mapping decisions as a reference when working with new data, follow these steps:
- Go to Mapping Accounts: Access Mapping Accounts from the main dropdown in PMI, or click the red alert box on the Home screen if mapping is required.
- Select Property and View Options: Choose the relevant property (or “All” if comparing across multiple) and enable all relevant View Options to ensure all account data is shown.
- Use Filters to Locate Mapped Accounts: On the left, use the filter “Mapped” to view accounts already assigned to profit centers. These represent your existing mapping setup.
- Review Mapped Accounts by Department: Select the department you’re working with (e.g., Rooms, F&B) using the dropdown at the top of the page. This filters the view so you only see accounts relevant to that department.
- Compare and Apply: Use the mapped accounts as a visual guide. You can then map new accounts accordingly using the dropdown menus on the right and apply changes via the cogwheel icon.
- Save Your Work: Don’t forget to click the diskette icon in the top-right to save your mapping updates.
Tip: There is no “side-by-side comparison” tool built in, but you can keep the same view open in two browser tabs to compare departments or time periods manually.
Currency display in Management perspective
In the Management Perspective view, currency is indicated on the right-hand side of the screen—typically shown as a label like K TRY, K EUR, or K USD, depending on the property’s configuration. This denotes that the performance values are displayed in thousands of the selected currency.
To confirm or adjust the currency in use, go to Administration → Advanced Settings → Currency Settings. These settings apply across multiple modules—including P&L and Benchmarking—and determine how financial values are displayed throughout various views in PMI.
Can I add or customize table columns?
In legacy PMI views — such as Management Perspective, Flash Report, Benchmarking, Portfolio Perspective, Schedule, and Labor Cockpits — tables are static. This means you cannot:
- Add new columns (e.g., “Yesterday’s Forecast”)
- Move columns around
- Resize or sort columns manually
These views are fixed by design and don’t support user-level customization.
Where Table Customization Is Possible
Only in revamped PMI views using the AG Grid module can you:
- Show or hide certain columns
- Reorder or resize columns
- Sort and filter data
These newer views are gradually replacing legacy ones to provide more flexibility.
Can I view or customize graphs in the Benchmarking module?
The Benchmarking module in PMI does not support graphs at all — neither in the desktop version nor in the app. It is a table-only feature designed for data comparison, not visual display.
Common Confusion: Flash Report vs. Benchmarking
- Flash Report (in the PMI app) does include graphs such as lines and bars, and offers visual comparisons.
- Benchmarking, by contrast, focuses on numeric comparisons across properties or regions, displayed in table format only.
If you’re looking to visualize trends or performance comparisons, try using the Flash Report in the mobile app instead.
Why is there a big difference in SMART hours between two months?
If you notice a significant difference in SMART hours between two months — like April and May — the most common explanation is a change in the Productivity forecast.
Quick Explanation
SMART hours are calculated using the following formula:
SMART Hours = Cost Driver ÷ Productivity Forecast
So, if the Productivity forecast is lower in May, even with the same cost driver (like number of covers or revenue), the result will be higher SMART hours. This doesn’t necessarily mean your staffing increased — it reflects a lower productivity expectation for that period.
What To Check
- Compare the Productivity forecast for both April and May.
- Look at the Cost Driver (e.g., revenue, covers) to see if it stayed consistent.
- Confirm that Productivity is set as the selected forecast in your SMART setup.
By aligning the forecast expectations with actual performance, you’ll get clearer insight into staffing efficiency across periods.

User already exists in the “chain” but cant be found
If you receive a message stating that “the user already exists in the chain” but cannot locate them through a search, follow these steps:
Steps to Resolve
- Navigate to Chain Level. Ensure you’re searching from the chain level in the breadcrumb navigation. Users associated with specific properties may not appear unless you’re viewing from the top level.
- Include Deactivated Users in Search. Deactivated users won’t appear in the default search results. Enable the option to include deactivated users in your search to locate them.
- Check User Status and Reactivate if Necessary. Once found, hover over the information icon next to the user’s name to check their status. If they’re deactivated, click the pen icon to edit their details and reactivate the account.
- Expand All Rows. Use the Expand All Rows feature to view all roles and properties associated with users. This can help identify if the user is assigned to a specific property or role.
- Add User from Chain. If the user exists in the chain, utilize the “Add user from chain” option when adding a new user. This allows you to assign them access to a specific property without creating a duplicate account.
- Contact HQ Administrator. If you’re still unable to locate the user, reach out to your HQ Administrator or someone with user admin rights. They can assist in verifying the user’s account and resolving any access issues.
Why does the column in the P&L module not say “Budget” even though I’m working with the Budget version?
You’re using the Budget version in the P&L module, but the staff-related column shows a different label—perhaps “Scheduled” or something entirely custom. Here’s why that happens and how to fix it.
The Real Reason: This setting isn’t controlled in the P&L module—it’s actually configured in the Cockpit. To make the column reflect Budget hours rather than another value (like Scheduled), follow these steps:
- Go to the Cockpit.
- Find the setting that defines whether the P&L module uses Scheduled hours or Budget hours.
- Switch the setting to use Budget hours.
- Save your changes and return to the P&L module.
Once done, the column will update to reflect the correct data type—Budget—instead of the previously displayed label.
Need help finding the setting? This article has the details: Use Forecast/Budget Hours from Cockpit in P&L Staff Module
Why does the Room nights total in the Cockpit differ from the rooms Live forecast?
Common Cause:
In most cases, the discrepancy is due to how the Cost Driver (Room Nights) is configured in the Cockpit.
- The Cockpit might be using Room Nights from the previous day as a cost driver.
- The Rooms Live Forecast typically shows Room Nights for the same day.
This mismatch leads to differing totals, even if the forecast source and timing are aligned.
What to Do:
- Open the Cost Driver settings in the Cockpit.
- Check whether Room Nights are based on:
- Previous day
- Same day
- Or another custom setting
- Align this with what you see in the Rooms Live Forecast for a fair comparison.
If everything else matches (forecast type, manual edits, import timing), this is the key area to check
Modifying “Other hours” via Data upload center
Yes, "Other Hours" can be modified using the Data upload center in PMI. However, understanding the difference between "Other hours" and "TKS hours" is crucial:
- TKS Hours: These are hours imported directly from your external Timekeeping System (TKS). They represent scheduled or actual hours recorded externally and synced with PMI. These hours cannot be edited directly in PMI.
- Other Hours: These are manually added hours or hours not imported via TKS, such as outsourced labor or specific tasks. These can be adjusted directly in PMI, including through the Data Upload Center.
Steps to Modify "Other Hours"
- Go to the Data Upload Center in PMI.
- Select the appropriate template for labor data upload.
- Input the correct department, date, and "Other Hours" values.
- Upload the file and verify changes in the Labor Cockpit.
For more details, refer to the Daily Routines in Labor Cockpit guide.
Worker missing from your schedule?
- Hidden but history intact → Deactivated: Name won’t appear in pick‑lists, but past shifts still show in reports. Reactivate by ticking “Active.”
- Profile gone entirely → Deleted: Worker can’t be found or reactivated (past shift records remain in reports, but profile is permanently removed).
PIA chat – R&P and financial context
If you’re using the Revenue & Productivity (R&P) module in PMI, keep in mind that this module focuses on revenue and productivity metrics rather than full financial reporting.
- Since not all cost data is available within R&P, the AI cannot provide full Gross Operating Profit (GOP) calculations.
- If cost-related insights are needed, AI will only infer potential GOP impacts based on available data but won’t generate GOP estimates unless explicitly asked.
- When a P&L module is present, the AI can incorporate a broader financial view, but without it, responses remain revenue and productivity-focused.
How to change covers on historical dates
If you need to update covers on a past date, use the Flash Report instead of Live Forecast. Follow these steps:
- Navigate to the Flash Report.
- Select the historical date you wish to edit.
- Click on the Edit tool (Pen icon).
- Manually adjust the covers as needed.
- Save your changes.
Note:
- Live Forecast is designed for adjusting future covers.
- Flash Reports handle updates for historical data, such as revenue and actual figures.
Goal Distribution Tool (GDT)
What is GDT? The GDT helps set long-term sustainability goals at the chain level, breaking them down into property-specific and monthly targets. These targets are visible in the GoGreen cockpit and Planning pages.
Goal Targets Not Displaying
- Ensure that goals have been properly set and distributed at the chain level.
- Check if the property has the required data, such as historical usage and occupancy figures.
- Verify that the property’s activities and local weather conditions have been factored into the calculation.
Understanding zero OTB in Flash report
In PMI, the Flash Report provides a daily overview of revenue figures, both actual and forecasted, across all departments. Users may encounter situations where the Flash Report displays zero On the Books (OTB) data for specific dates leading to concerns about data accuracy.
Clarifying OTB in Flash Reports
It’s important to note that the Flash Report does not directly display OTB figures. Instead, it presents actual revenue data up to the current date and relies on the Live Forecast for future dates. The Live Forecast incorporates OTB data, which represents revenue from existing bookings or sales for upcoming dates. Therefore, if revenue actuals are zero for specific dates, the OTB for those dates will also be zero, reflecting no current bookings or sales recorded.
Changing revenue for today & tomorrow in PMI
Key Points to Remember:
- Budget & Forecast Module changes totals on a monthly basis only.
- Flash Report allows you to edit historical values.
- Live Forecast allows you to edit future values (including today and tomorrow) by switching to “manual.”
Steps to edit revenue for historical dates (Past)
- Open the Flash Report.
- Expand or select the past date you want to edit; click the plus icon.
- Click the pencil icon (if available) to override the revenue value.
Steps to edit revenue for future dates (Today & Tomorrow)
- Go to the Live Forecast.
- Expand or select the specific date (e.g., today, tomorrow).
- Switch the date to “manual” if required.
- Enter the new revenue value in the editable field.
Missing labour cost in Portfolio perspective
If you’re not seeing any labour cost for some properties in Portfolio Perspective.
Explanation & Resolution:
- Empty Box Means No Data: In Portfolio Perspective, if a box is empty, it indicates that there are no actuals recorded for that metric. In this case, no labour cost data exists for the property.
- Simplified View: While PIA offers many options, the intention is to keep the display straightforward. The empty box is the system’s way of confirming there’s no data to show, avoiding potential confusion from too many displayed options.
- Reference: This behavior is clearly detailed in the Portfolio Perspective Overview article.
Why is the Save button greyed out in PMI?
This is not an error - it’s expected behavior. In PMI, the Save button acts as an on-screen indicator of whether any changes have been made:
- When changes are made, the button becomes active (blue) — prompting you to save.
- Once you’ve clicked Save, or if no changes have been made, the button returns to its grey (disabled) state.
This visual cue ensures users don’t accidentally re-save unchanged data and helps confirm that changes have been successfully applied.
Ensuring accurate revenue mapping for accounts
Ensure that revenue linked to each account is accurately mapped and displayed in PMI. Start by reviewing the Flash Report to confirm that imported data aligns with your expectations. When hovering over a figure in the Flash Report, the tooltip will display:
- The actual accounts imported from your PMS (Property Management System) or POS (Point of Sale) system.
- The associated revenue for each account.
If discrepancies occur, review the Mapping module to adjust or reassign accounts as needed.
Low SMART Hours?
If your cockpit displays unexpectedly low SMART hours, the most common cause is that the Productivity forecast is set too high.
Why This Happens:
- The SMART forecast is calculated by dividing the primary cost driver forecast by the Productivity forecast. When the Productivity forecast is inflated, the resulting SMART hours decrease.
What to Do:
- Review the Productivity Forecast: Check that the forecast value accurately reflects realistic performance targets.
- Adjust and Recalculate: Modify the forecast if necessary and recalculate the SMART hours to see the updated totals.
For more detailed steps, refer to our SMART cockpit guide.
The Pioneers Behind PMI: From Deadline to Online Empowerment
Providing context for better insights
Issue: Users ask broad questions like “Where is my data?” or “What do these figures tell you about my productivity?”without providing sufficient context or visual input.
If you're unsure why specific data or insights aren't displaying as expected, ensure your query includes enough context. You can also use the Query Library, which offers premade queries tailored to common needs—screenshots are automatically added when required for these queries.
For custom queries, consider taking a screenshot of the relevant data or view by clicking the camera icon. Providing clear context or visuals helps the AI analyze your data more effectively and deliver accurate responses.

Can you activate a Live forecast accuracy report in Power BI?
The PMI system integrates Live forecast accuracy into its PMI Index calculations. Although Live forecast accuracy contributes to the PMI Index, it is not explicitly shown as a separate report in PowerBI.
Why is the hours total different in the table and the graph?
The difference in hours comes down to the type of forecast being displayed:
- Management Forecast (Table): This is the forecast set manually by management, based on their expectations and strategic goals. It reflects planned hours to meet operational needs.
- SMART Forecast (Yellow Bar in Graph): Generated by PMI’s SMART system, this forecast uses machine learning and historical data to provide a dynamic suggestion. It factors in monthly productivity goals and current hotel activity.
The variation between these two forecasts highlights the difference between static planning (Management Forecast) and data-driven predictions (SMART Forecast). Use this insight to adjust plans as needed for better alignment with real-time performance and goals.

Glossary of Terms
Stuck on a term or abbreviation? Check out our PMI Glossary for quick definitions and insights into common terms and abbreviations. Simplify troubleshooting by understanding the language behind the processes!
Key Notes for Adjusting Min/Max Settings
- Effect of Changes: Changes to Min/Max settings will impact the current year and all future years but will not apply to past years.
- Global Application: Adjustments to Min/Max hours are applied globally to the selected year, not on a month-by-month basis. Always ensure the correct year is selected before making changes.
Resolving Data Discrepancies Between PMI and Your Source System
The data in PMI are extracted not only from an export file we receive but also through various active APIs that provide real-time data from the source system interface. If you find any discrepancies, you can cross-check the figures using the Import status module in PMI. The module lets you track down imported data at a granular level, which can considerably simplify the process of validating the figures.
If discrepancies or missing data between PMI and the source system persist, the first step should be to inspect the PMI settings and mappings. You can also open a support ticket at your chain's service desk or the source system provider. When doing so, include all relevant information and specify that the issue is related to data discrepancies between the source system interface and PMI.
Excluding segments from driver-based calculations
It is not possible to stop Machine Learning (ML) from including an existing segment in the driver-based calculation. If the ML Live Forecast doesn't align with your expectations, you have the option to manually override it or construct a custom driver to make necessary adjustments.
Troubleshoot data in the Import Status view
Accessing the Import Status View:
- Navigate to the main menu and select Import Status.
- Choose your desired chain, property, status, and interface filters.
- The view will display detailed import information for the selected property.
Troubleshooting Missing or Delayed Data:
If Interface Status is “In progress”: This indicates that data is actively being imported and is currently in the ingestion queue. It will soon “arrive” and be visible within PMI.
If data appears to be missing:
- Use the search (magnifying glass) to drill down into the details.
- Compare the data received with what’s displayed in PMI to ensure alignment.
- Check for potential issues like unmapped accounts or ignored figures that may prevent data from appearing.
- If discrepancies persist, consider performing a new import to refresh the data.
Efficient Data Analysis Without Using the Query Library
If you don’t use the query library, you can still take screenshots and ask questions. The bot remembers the last 5 interactions, allowing you to ask it to analyze data in light of recent screenshots. You can switch between views, capturing snapshots and instructing the bot to wait for the next screenshot before responding. This way, you can efficiently gather and analyze data across different screens.
What does GG stand for?
In PMI “GG” stands for GoGreen. This initiative focuses on sustainability and environmental responsibility. The abbreviation “GG” is commonly used by users when referring to sustainability tools and features within the full PMI software suite called GoGreen. For more about the GoGreen module view this article: GoGreen home overview.
Invisible split shifts in schedule printouts without codes
If you're experiencing issues with split shifts not showing when printing the schedule without codes, it could be due to the level at which the shift code was created. Here's a brief troubleshooting guide:
- Check the Shift Code Level: If the shift code was created at the department level, it will only be visible within that specific department. This means that if an employee is working a split shift across multiple departments, the full details of her shift won't be visible in a single department's printout.
- Create Shift Code at Property Level: To view the times from other departments in the printout, the shift code must be created at the property level. This allows the shift code, and therefore the details of the split shift, to be visible across all departments.
- Adjust Print Settings: Ensure that your print settings are adjusted to include shift codes. This can be done in the Schedule module under the Tools menu.
- Verify the Printout: After making these adjustments, print the schedule again to verify that the split shifts are now visible .
Forecast discrepancies in cockpits
If the forecast data in the cockpit does not match the actuals, showing discrepancies in the Monthly To Date (MTD) usage, a potential cause is that a cost driver was not forecasted, leading the system to calculate zero forecast and only display actuals.
Steps to Resolve:
1. Verify Cost Drivers: Ensure all relevant cost drivers have been forecasted for the period in question.
2. Update Forecasts:
• Navigate to the forecast module.
• Ensure all cost drivers are included.
• Resubmit the forecast for the affected month(s).
3. Verify Correction: Check that the cockpit now displays the correct forecast and actual hours.
Split management in the mapping view
Here is a short introduction to understand how values or accounts are split across multiple departments in PMI.
Split Mapping Overview:
- Splits allow you to allocate a percentage of an account’s value to multiple departments. For instance, if a revenue account is relevant to both the Executive Lounge and Breakfast, you can use the “Split mapping” feature to divide the value accordingly.
Configuring Splits:
- Access the Mapping Module: Navigate to the Mapping module in PMI.
- Set Split Percentage: In the mapping table, set the “Split percentage” for all visible accounts. Typically, this is 100%, but it can be adjusted based on specific needs (e.g., commissions, tax percentages).
- Allocate Values: Allocate the relevant values to the desired departments by adjusting the split percentages. For example, you can allocate 50% of a revenue account to the Executive Lounge and 50% to Breakfast.
Viewing Splits:
- Mapping View: In the Mapping view, you can quickly see which accounts and values are allocated to which departments. This includes any splits that distribute a single account’s value across multiple departments.
Validating Splits:
- After configuring the splits, you can validate them by checking the Flash Report or Live Forecast in PMI. The registered revenue on your trial balance should correspond to what is recorded in PMI 1 .
- If you import the rooms forecast, you can check your original file with what is recorded in PMI on future dates in the Flash report or Live forecast 1 .
- If discrepancies persist, inspect the PMI settings and mappings, and cross-check the figures using the Import status module in PMI 2 .
Adjusting productivity targets in budget and forecast
Issue: Productivity targets are not aligning with actual performance, and adjustments are needed to improve the PMI adoption index score.
Recommendation: One idea can be to copy the Live forecast number into the Forecast to align the numbers initially. Adjustments made in the Budget and Forecast module are critical for accurate performance tracking and cannot be altered directly within the PMI adoption index view. Always ensure that updates are communicated with relevant stakeholders, especially if a controller sets these values.
- Navigate to the Budget and Forecast module in PMI.
- Compare the current productivity targets with actual performance metrics.
- If discrepancies are found, update the productivity targets to better reflect realistic goals.
- Ensure that the targets align with the monthly forecast to maintain accuracy.
- After making necessary adjustments, save the changes to ensure the new targets are reflected in the system.
- Regularly monitor the productivity metrics to ensure the targets are being met.
- Re-evaluate and adjust targets as needed to reflect any changes in operations or business needs
Inability to edit data for a specific period
A "frozen" screen issue could be related to period locking. This would result in an inability to make any modifications to schedules, reports, or other entries for a specific period.
- Check the Period Locking Settings: This issue is often related to the period locking feature in the PMI system. When a period is locked, it prevents any changes from being made for that time frame. Check the period locking settings for the specific month to see if it has been mistakenly set to close.
- Unlock the Period: If the period for the specific month is locked, you will need to unlock it. This can be done by accessing the period locking settings in the PMI system. Double click on the padlock icon for the specific month to unlock the period. Note that you may need administrative rights to do this.
- Contact PMI Support: If the issue persists even after unlocking the period, or if you are unable to unlock the period due to lack of permissions, contact the PMI support team for further assistance.
Difference Between Live Forecast and PMI Prediction
If there is a recalculation of the PMI Prediction due to season generation, new file import, or manual calculation, it takes time for the ML algorithms to fully update. The Live forecast values will only update once all dates in the viewed period are completely updated. Thus, there might be a delay, and the Live forecast might not immediately match the PMI Prediction.
Manual changes overwritten at Live forecast import
Legacy PMI System
- Issue: Pickup column doesn’t “gray out” when importing Live forecasts.
- Cause: This is the design of the legacy PMI system.
- Effect: Manual changes in the pickup column will be overwritten with each import.
New PMI System
- Preserving Manual Changes:
- Enable Editing: Click the robot icon (if auto-forecasting is enabled) or the import icon next to the day you want to edit.
- Edit Value: Enter your desired value in the pickup column (only editable column for future days).
- Save Changes: Press “Save”.
- Result: Your changes will be preserved even after a new import, indicated by a person with a pencil icon.
Different hours for similar revenue on different dates can vary!
Recommended hours for similar revenue on different dates can vary due to a combination of factors including the monthly productivity forecast, historical staffing patterns, and other factors recognized by the machine learning capabilities of the SMART forecast.
Enhancing forecast accuracy: Leveraging PMI’s auto forecasts
Discrepancies in the imported Room Night live forecast can impact the generation of live forecasts for arrivals, departures, and stayovers. To address this, it's recommended to utilize PMI's auto forecasts. These forecasts are typically more accurate as they rely on machine learning and historical data. Ensuring the accuracy of the imported Room Night live forecast is crucial, as it directly influences the precision of your live forecasts. Regularly review and adjust your forecasts to maintain their reliability and effectiveness.
Activating PMI Automation for Room Forecasts
If your room forecasts are still in manual mode and you want to activate PMI automation, you can use the “Calculate Live Forecast” tool in the Live Forecast view without needing to contact support. Follow these steps:
- Access Live Forecast View: Navigate to the Live Forecast view in your PMI software.
- Open Tools: Click on the “Tools” menu to open the Live Forecast tools.
- Calculate Live Forecast: Select the “Calculate Live Forecast” option.
- Set Source to PMI Prediction: Ensure that the source is set to “PMI Prediction” rather than “DP forecast import.”
- Execute Calculation: Click on “Calculate” to automate the room forecast based on PMI predictions.
This process will switch your room forecast from manual to automatic mode, utilizing the accurate PMI predictions for better forecasting.
Adjusting decimal precision in the labor cockpit table
If you're having trouble manually entering decimal precision in the cockpit table, please review the settings in the Tools menu:
- Open Tools Menu: In the PMI Labor Cockpit, navigate to the Tools menu 1 .
- Access Settings: Click on "Settings" within the Tools menu 1 .
- Change Decimal Precision: Find the option for setting the number of decimals for hours. Adjust to your preference.
- Save Changes: Confirm and save your changes.
- Check Changes: Return to the Labor Cockpit to ensure your changes have been applied correctly.
If the issues persist, consider reaching out to PMI support for further assistance.
Understanding Full-Time Equivalents (FTEs) in PMI Scheduling
FTE, or Full-Time Equivalent, is a unit that measures employee workload. In PMI, FTEs can be displayed in the scheduling module instead of hours, providing a more intuitive understanding of staffing levels. The number of hours a FTE works per day can be set in the cockpit settings. The Staffing guide in PMI uses the determined FTE to suggest daily hours in 0.5 FTE increments, ensuring practical scheduling.
WalkMe – Step-by-step guidance
The step-by-step guidance previously offered within PMI through the WalkMe tool has been phased out. We have transitioned to providing support directly through our comprehensive knowledge base, instructional videos, and the enhanced capabilities of PIA chat. These resources are designed to deliver more dynamic and in-depth assistance to meet your needs.
PIA – Productivity Intelligence Aid
PIA stands for Productivity Intelligence Aid and was the name of a support feature in PM that provided first-line support and assistance. Today we have updated that chat bot with an enhanced AI helper called PIA chat. It's a sophisticated AI-powered companion that brings the power of OpenAI’s latest advancements to your fingertips.
Server error message in PMI
Encountering server errors in new PMI views like GoGreen, can be a frustrating experience that hampers your operational efficiency.
Here's what you can do:
1. Refresh Your Browser: A quick fix that works more often than you'd think. Simply refresh your browser page. This can sometimes eliminate temporary glitches causing the server errors.
2. Clear Your Browser Cache: Stored cache and cookies in your browser can occasionally lead to server errors. Clearing your browser's cache and cookies removes these stored files and can resolve the error. Here's a quick guide on how to do it:
- Google Chrome: Go to Settings > Privacy and security > Clear browsing data.
- Firefox: Go to Options > Privacy & Security > Clear Data under Cookies and Site Data.
- Safari: Go to Safari menu > Preferences > Privacy > Manage Website Data > Remove All.
- Microsoft Edge:
- Click on the three dots in the top right corner to open the menu.
- Select Settings > Privacy, search, and services.
- Under "Clear browsing data", click "Choose what to clear".
- Select "Cached images and files" and "Cookies and other site data" then click "Clear now".
3. Check Your Internet Connection: A poor or unstable internet connection can be the root cause of server errors. Test your internet connection by visiting other websites or using an online speed test tool. If you're on Wi-Fi, try moving closer to your router, or consider switching to a wired Ethernet connection for more stability.
Ensuring Up-to-Date Data in PMI Predictions
Understanding when and how PMI prediction data refreshes is key to maintaining accuracy and trust in the system. Here's a brief guide:
- Data Refresh Cycle: PMI predictions are typically updated automatically at regular intervals. Daily refreshes handle short-term forecasts (0-10 weeks), weekly updates are for mid-range forecasts (11 weeks to 6 months), and biweekly updates manage long-term forecasts (6 months to 16 months).
- Discrepancy Concerns: If you notice any discrepancies in the data, consider the last automatic refresh time. Data discrepancies right after an automatic update could point to potential import issues or the need for additional data review.
- Manual Refreshes: In special cases where immediate data correction is needed, d2o support has the capability to trigger a manual refresh. This is particularly useful if significant data changes occur outside the regular update schedule, or if there are urgent corrections to be made.
- Contacting Support: Should you need a manual data refresh or if you have concerns about the data integrity after the scheduled refreshes, reach out to d2o support. Provide them with the specifics of the issue, and they can guide you through the manual refresh process if necessary.
- Monitoring Import data
- PMI Prediction explanation
Navigating PMI Prediction Algorithm Accuracy
Having trouble with the PMI prediction algorithm? Follow these streamlined steps to identify and fix data-related issues:
- Verify Import Status: Begin by checking PMI's import status page to ensure data is being correctly updated. Any import problems will be flagged here.
- Review Data Integrity: Use the drill-down feature to review imported data and verify its accuracy against your expectations.
- Identify Outliers: Look for any anomalies in your data. Outliers can significantly impact automated forecasts, potentially skewing predictions.
- Engage PMI Support: If after these checks the predictions still seem inaccurate, reach out to PMI support for deeper insights and potential adjustments for better accuracy.
The PMI algorithm is designed to refine its forecasts continually. Variations are expected, particularly with new booking patterns or changes in cancellation rates. However, persistent discrepancies need attention to ensure reliable predictions.
View option for information and calculation rows in the schedule
If you're having issues with the custom rows (information and calculation rows) in the PMI Schedule, here are some things to consider:
- Green Rows: The custom rows in PMI Schedule, both information and calculation rows, are displayed with a green background color. This is a design feature to help users easily identify these rows.
- Visibility Issues: If one user can see the green rows but another user cannot, it's likely due to the 'View Options' settings. Each user's view can be customized in PMI, and these settings can affect the visibility of the green rows. To ensure these rows are visible, check the 'View Options' settings and make sure the option to "Show information" rows is enabled.
- Access Rights: Remember, the ability to add or modify these custom rows might be restricted based on a user's access rights. Typically, users with administrative rights or specific departmental roles can add or modify these rows.
- Data Input: For information rows, you can manually input relevant data as a reference point when scheduling. For calculation rows, they are used to calculate the number of hours that will be needed, based on a specific rule. Make sure the data input is correct to ensure accurate calculations
Role requirements to be able to adjust and update a schedule
If you want to change a schedule in PMI, you usually need to be a manager, like a Department Head or Front Office Manager. You can make these changes in the PMI scheduling module's cockpit, for both past and future schedules. Remember, you need to have cockpit owner or administrator rights to change Min/Max settings, which affect the SMART forecast and scheduling.
Correct, change, register or add consumption
To register consumption, use the 'Add consumption' button within the cockpit. This allows for the input of new consumption values easily. If needing to update an entry, simply input the new value; PMI will override the previous entry with the new one, ensuring the latest data is always reflected. However, note that imported values cannot be overwritten in this manner. For tracking food waste specifically, use the "Production" category to enter total food waste figures accurately.
Resolving User Access and Role Changes in PMI
Management of user-related requests for some chains and properties are managed centrally and not PMI support. If this is the case for you then kindly open a ticket through your own chain support platform.
Below is a general step-by-step guide to request PMI user access on Hotel Kit management platform:
- Go to the Tasks section.
- Click on Add Task and select your hotel chain.
- Proceed to Select Template.
- In the search bar, type PMI and then click on the template for New PMI User.
- Under Rights Needed, specify the access this new user requires. For example, if the access level should match an existing account, simply enter the name of the individual holding that access (for instance, if a new Front Office member should receive the same access as the current Front Office Manager, simply enter the Front Office Manager's name).
Please adjust these steps according to your chain's specific task management platform.
Incorrect codes in TKS
Make sure the correct codes have been used in your TKS. If the hours are still not correct after the next import, there may be an error in the mapping – please contact your controller who will make the necessary changes.