The GM Daily Digest is designed to be a concise, action-oriented snapshot for General Managers, emphasizing what’s changed, where the risks are, and what needs immediate attention. While many KPIs overlap with the Management Perspective view, the Digest presents them...
management perspective
Video playlists
Video tutorial playlists Welcome to our comprehensive collection of PMI video tutorials, organized by topic to facilitate your learning journey. Whether you’re new to PMI or seeking to deepen your expertise, these playlists offer structured guidance across various...
Consolidated view in Benchmarking and Management Perspective [3:20]
In this video, we’ll show you how to create and manage productivity departments using the PMI software suite. This feature is super handy for consolidating food and beverage outlets or setting up separate departments for areas like meetings and events. Let’s get into...
Management perspective overview [3:06]
Why are my departments marked in red
When rows in the table or bars in the graph are red, the respective cockpit has not been saved for the last day(s).
I want to see my actual submitted numbers
To see submitted Forecast, Budget or Actual Last Year, select “Incl static number” box in View options. An additional column will appear to the right of SMART, displaying the submitted Forecast, Budget or Actual Last Year, depending on the choice made.
What are the Key Performance Indicators (KPIs) in Management perspective?
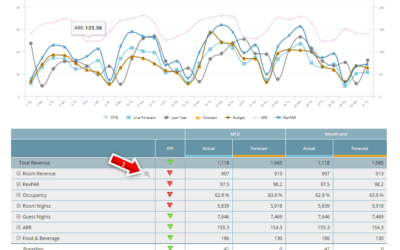
Key Performance Indicator (KPI) is a type of performance measurement. In PMI, a symbol is used to show the correlation of specific indicators to Forecast, Budget and Last year. The direction of the arrow shows the trend compared to last year. An arrow pointing upwards...
What is the Management perspective?
The Management perspective is a consolidated report that gives the most complete picture for pin-pointing total and departmental performance, in terms of both revenue and productivity, month-to-date and month-end. How is the revenue pacing for each department compared...
Management perspective overview
Summary The Management perspective in PMI provides a comprehensive overview of your property’s performance—past, present, and future—within a single view. It integrates key performance indicators (KPIs), revenue, labor hours, and productivity metrics to assist in...


