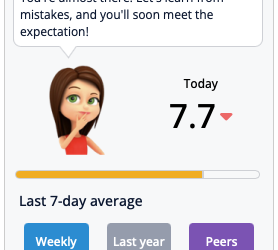
To access Group view or Chain view in the PMI Adoption Index (or GoGreen index): From the Home screen, click the PMI adoption index tile (found in the left-hand menu under PMI R&P) Inside the Adoption Index dashboard, look for the View selector in the top-left...
Geson Perry
Using staffing guide values as temporary productivity targets
Using Staffing Guide Values as Temporary Productivity Targets To use Staffing Guide values as temporary productivity targets in PMI: Go to the Budget & Forecast module Manually enter the staffing-guide values for each department and period Click Save to apply...
Fallback value when head-office targets are missing
When head-office targets aren’t yet available, use the Staffing Guide baseline as your fallback value. This baseline is calculated using PMI’s internal logic based on historical data and current cost drivers. If the Staffing Guide baseline leads to a lower RevPOLU...
SMART schedule not updating?
If your SMART schedule isn’t updating as expected after clicking Save (which causes the Save button to turn grey), here are key steps to verify and resolve the issue: Confirm On-Screen Indicators: After saving, check for the green dashed vertical line in the schedule...
Understanding the Scheduled Horizon and Graph Lines
The Scheduled Horizon in PMI shows how far into the future schedules are active and where PMI’s SMART forecast begins. In Legacy Tables and Schedule Views: Red vertical line = Today Dashed green vertical line = Scheduled Horizon Beyond the green line, users can...
How can I change the property name in PMI?
Changing a property name in PMI isn’t something users can do themselves. Property names are tied to the system hierarchy and managed centrally by d2o. If you need to change the name of a property, please contact d2o Support or your PMI administrator. They will make...
How to activate consolidated views in PMI
Consolidated Views allow you to group properties or brands (e.g., 5-star, regional, or discount chains) and compare their performance across departments. Step-by-Step Guide Set Up Productivity Departments (Benchmarking Module) Go to Benchmarking in the side menu....
Why do I not have any index?
The Index — formerly called the PMI Index and now officially known as the PMI Adoption Index—measures how effectively a property or department uses PMI to manage resources and improve productivity. A score of 8.0 is good, and 8.5 or above is considered excellent....
Mapping a demo site in PMI
The Mapping Demo is the first step when preparing an anonymous demo site with fictitious departments and property names. It’s accessible under Global settings > Mapping Demo in PMI. Note: this feature is available only to d2o employees What’s it for? Use Mapping...
Manually link Forecast revenue from R&P to Planning
To manually link forecast revenue from the Revenue & Productivity (R&P) module to the Planning module in PMI: Go to the P&L module → Accounts. Select the account you want to link (e.g., Room Revenue). Under Source Definition, choose the source data, such...


