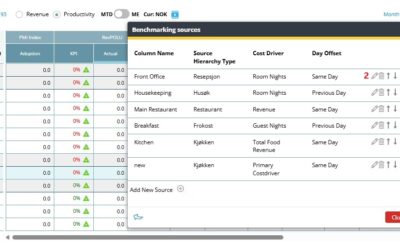
Objective This guide explains where to find the source information used for the columns in the Productivity display in Benchmarking. It also shows how to add new columns. Requirements Users with HQ roles (Management Team, Head Office Representatives) Steps Step 1 –...
benchmarking
Benchmarking release note – Using the Cockpit’s primary cost driver 12.25
Benchmarking now supports the same primary cost driver as the Cockpit in the Productivity Displays Benchmarking Productivity Setup sources has been updated to use the same primary cost driver as the Cockpit. This makes it easier to keep your performance analysis...
Benchmarking enhancement – 01.25
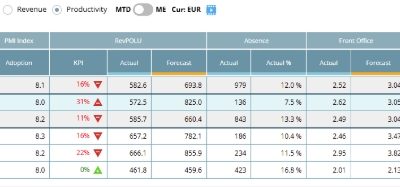
A small enhancement has been made to the Benchmarking page. When viewing Productivity, there is now a toggle with the option to view Total productivity or Operational productivity. Image description: Option to toggle between Total and Operational productivity in the...
Video playlists
Video tutorial playlists Welcome to our comprehensive collection of PMI video tutorials, organized by topic to facilitate your learning journey. Whether you’re new to PMI or seeking to deepen your expertise, these playlists offer structured guidance across various...
Benchmarking overview [3:06]
Benchmarking module in PMI. This tool helps you compare your property’s performance with others in your group. Let’s dive in and see how you can use it to spot areas for improvement and boost your performance. Overview Summary: The Benchmarking module in PMI lets you...
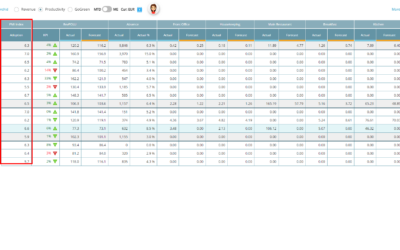
Benchmarking: PMI Index value updates based on time period selected – 06.23
What’s new? In the Benchmarking module of PMI, when viewing Productivity, the Adoption Index value now follows the following logic: When viewing MTD: The value shown is the average index score for the property month to date. When viewing Month-end: The value shown is...
GoGreen benchmarking enhancement – 01.23
GoGreen is now a benchmarking option in the regular benchmarking page in PMI. This feature gives you the opportunity to see how you are managing your environmental resources compared to the forecast, as well as your peers, and helps to keep you on track. Here, you can...
Benchmarking calculation enhancement – 03.22
In Benchmarking, productivity page setup source can now be reversed, i.e it is possible to turn around the calculation, an example – setup a source to show how many hours you use per room night. Contact support if this could be of interest.
Consolidated view in Benchmarking and Management Perspective [3:20]
In this video, we’ll show you how to create and manage productivity departments using the PMI software suite. This feature is super handy for consolidating food and beverage outlets or setting up separate departments for areas like meetings and events. Let’s get into...
Can I change the properties I see in Benchmarking?
In View options of the Benchmarking module, you can choose what you want to display. Here you can exclude/include different groups. Which properties you see is dependent on your region, user rights and preference

