
Some values you see in Planning assumptions are entered by you, while others are calculated by PMI.
This article explains where calculated values come from, including actuals, variances, group distributions, Fast-fill, Auto-fill, and Plan vs Actual totals.
How PMI displays actuals
For an assumption used in a P&L formula, PMI displays the value based on the available actual data and how the assumption is configured.
Scenario 1: Actuals are available
When actual P&L data is available, PMI calculates the actual value based on the relevant setup:
- Standalone assumptions: Actuals are calculated from the P&L formula using the assumption.
- Groups without departments or accounts defined on the child assumptions: Actuals are calculated from the P&L formulas using the assumptions.
- Groups with departments or accounts defined on the child assumptions: PMI uses the department and account setup to determine the actuals instead of calculating them from the P&L formula.
This means that when departments or accounts are defined for the child assumptions, that setup takes priority for displaying actuals.
Scenario 2: No actuals are available
If actual data is not yet available for a month, PMI displays the forecasted value instead.
This allows you to see a value for the month even before actual data has been received.
Scenario 3: Actuals cannot be calculated
If PMI cannot calculate an actual, for example because a value required by the formula is missing, the cell shows a warning. Hover over the warning to see the reason.
For more information about the different icons and tooltip messages, see Understanding actuals and tooltips.
How PMI calculates actuals for formula-linked assumptions
When a Planning assumption is used in a P&L formula, PMI can calculate an implied actual for a closed month.
PMI already knows the actual result posted to the P&L account. It uses the formula in reverse to work out what value the assumption would need to have produced that result.
For example:
Account formula: Assumption × linked account
Becomes: Assumption = Base account actual ÷ Linked account actual
Example – 3312, January 2026
- 3312 – The account’s actual result is 2,562.
- Rest 1 – The linked account/data source actual used in the formula is 2,295,357.
PMI calculates:
2,562 ÷ 2,295,357 = 0.1%
The Planning assumption therefore shows an implied actual of 0.1% for that month.
For more complex formulas, PMI works backwards through the known parts of the formula to isolate the assumption.
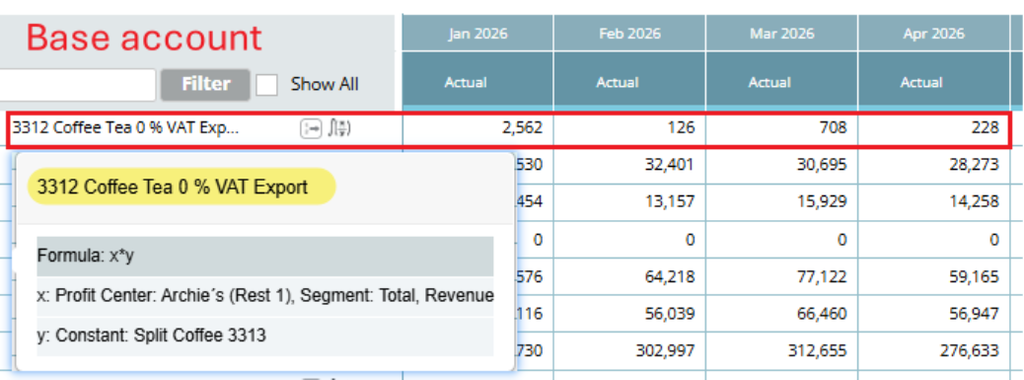
P&L account: Base account with linked account in formula tooltip
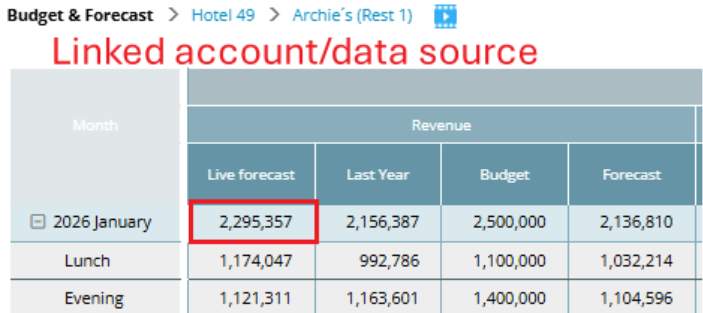
P&L account: Source in the base account formula in the Profit center (Budget & forecast)
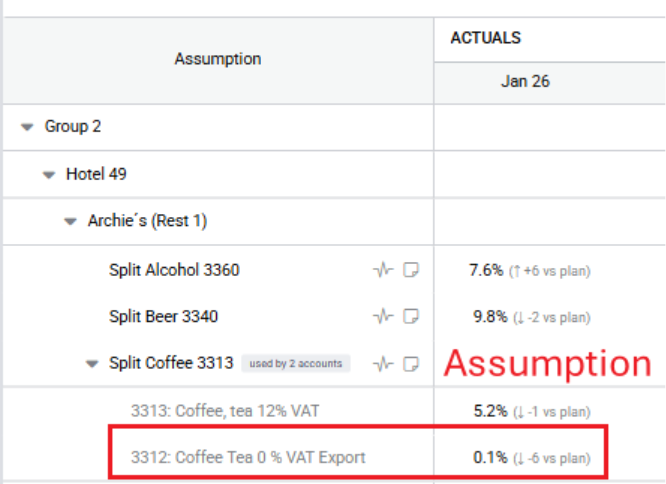
Assumption calculated result
What happens when PMI cannot calculate an actual?
PMI does not invent a value when the calculation cannot be completed.
- If a value needed by the formula is missing, the cell will show a grey information icon with more details in a tooltip.
- If no values have been imported for the base account or for the linked account for a full applicable year or current-year actual months, PMI shows an amber warning instead.
- If several formulas use the same assumption, PMI lists all the accounts with its actuals separately
These calculated actuals are view-only. They do not overwrite your stored budget or forecast values.
How PMI handles assumptions used by multiple accounts
One Planning assumption can be used by more than one P&L account.
This is useful when the same planning driver applies to several accounts, for example when one product is posted to different accounts.
PMI identifies the accounts through the formulas that use the assumption. You do not create a separate account mapping for this.
What you see
When an assumption is used by multiple accounts, the row can be expanded to show the individual account details.
For a percentage assumption, each account is shown separately because the percentages should not be added together or averaged.
For an amount assumption, each account shows its own actual value.
The account details are read-only.

Standalone assumption used by two accounts
Why isn’t there one total for the assumption?
The Planning assumption itself contains the plan value. The account rows show how the actual result relates to each account using that assumption.
This prevents PMI from presenting a combined figure that could be misleading, particularly for percentage assumptions.
How PMI calculates variance vs. plan
Variance shows how the actual result compares with your plan.
PMI calculates:
Variance = Actual − Plan
The plan is your forecast when you are in a forecast view and your budget when you are in a budget view.
Example
You planned 24% and the implied actual is 25%.
PMI shows:
25% (↑ +1 vs plan)
The +1 means the actual is one percentage point above the plan.
For an amount, the same rule applies. A positive variance means the actual is above the plan, while a negative variance means it is below the plan.
Hover over the comparison to see the Plan, Actual, and Variance details.
No variance is shown when there is no stored plan, no actual can be calculated, or the row does not have a single comparable actual.
How PMI creates starting values for an assumption group
When you create an assumption group, PMI can suggest the starting percentages for the child assumptions.
Even per month
With Even per month, PMI divides 100% equally between the children.
For example:
- 2 children → 50% each
- 3 children → approximately 33.3% each
- 4 children → 25% each
These are starting values that you can adjust.
Historical actuals
When you choose a historical method, PMI calculates each child’s share of the total actuals for that month.
The calculation is:
Child actual ÷ total child actuals × 100
Example
In January:
- Wine actual = 60,000
- Beer actual = 40,000
- Total = 100,000
PMI suggests:
- Wine = 60%
- Beer = 40%
These suggested percentages become the group’s starting values. You can change them before saving.
If there is no useful historical data, PMI cannot create a meaningful historical split and the relevant historical option may not be available.
How PMI calculates Fast-fill
Fast-fill can use different methods, and each method calculates values differently.
Fast fill can only be used on individual assumptions – standalone or within a group, but it cannot be used on a parent/group assumptions.
Even per month
PMI divides the amount equally across the months that can be filled.
Locked and closed months are skipped. The remaining months share the full amount.
For example, if you enter 10,000 and 11 months can be filled:
10,000 ÷ 11 = 909.09
The final month receives the rounding remainder so that the total is exactly 10,000.
Monthly
In Monthly mode, the amount you enter is applied to every eligible month.
For example, entering 500 across 11 eligible months gives:
500 × 11 = 5,500
Each eligible month receives 500.
Use historic pattern
PMI uses the historical month’s share of the total to create the new monthly pattern.
For example, if your source account had:
- January = 100
- February = 200
- March = 300
the total is 600, so the historical pattern is:
- January = 16.7%
- February = 33.3%
- March = 50%
If you Fast-fill 12,000, PMI distributes it using those proportions:
- January = 2,000
- February = 4,000
- March = 6,000
If one of those months is locked, PMI redistributes the amount across the remaining eligible months rather than holding that month’s share back.
Pull the data from a formula
When you choose Pull the data from a formula, PMI uses the selected P&L formula to create the monthly values from the chosen baseline year.
It does not scale the values into a total. Each month uses the value calculated from the selected formula for that month.
If the formula cannot produce a value for a month, PMI writes 0 for that month.
Fast-fill supports a maximum of 24 months.
How PMI fills new months automatically
When Auto-fill new months from history is enabled for a standalone assumption, PMI fills the single newly available month at the end of the rolling planning period.
There are two options.
Same month last year
PMI uses the value from exactly the same month one year earlier.
For example, if the new month is August 2027, PMI uses the value from August 2026.
Same as the previous month
PMI uses the most recent earlier value available for that assumption.
The value does not need to come from the immediately preceding month if that month has no value.
Important to know
Auto-fill:
- Fills only the newly available month.
- Does not overwrite an existing value.
- Creates an editable value.
- Uses the assumption’s own history.
- Can fill both budget and forecast series.
- Leaves the month empty when the required source value does not exist.
How PMI calculates a group’s running total
For a percentage-based assumption group, PMI adds the child percentages for each month.
For example:
60% + 25% + 10% = 95%
The group row therefore shows 95% and the group is incomplete.
The target is 100%.
A small rounding difference, such as 99.9999% from an even split, is treated as 100% and does not create a warning.
Groups that contain a mixture of percentage and amount assumptions do not show a percentage total.
How PMI calculates an amount group total
For a group containing amount assumptions, the group row shows the sum of its child values for that month.
For example:
10,000 + 5,000 + blank = 15,000
A child with no value does not contribute to the total.
If no child has a value, the group total remains blank.
How PMI determines the actuals period
The ACTUALS/FORECAST boundary is based on the property’s Actuals offset setting.
It is therefore not simply based on today’s date.
PMI uses the property’s configured delay to determine whether the latest month’s actuals should be treated as available.
Example
With a 7-day offset delay:
- On March 5, February may still be treated as forecast because the actuals have not yet reached the required point.
- On March 9, February becomes an actual period.
This same boundary determines:
- Which months are shown as actuals
- Which cells can be edited
- Which months Fast-fill can fill
- Which months are included as actual periods in the export
How PMI calculates Plan vs Actual export totals
The Summary sheet in the Plan vs Actual export uses closed months that produced a valid actual value.
Forecast months are excluded.
Months where PMI could not produce a valid figure are also excluded from the totals.
PMI then calculates:
Difference = Actual total − Plan total
Difference % = Difference ÷ Plan total
Example
If:
- Plan total = 60,000
- Actual total = 63,000
Then:
Difference = 3,000
Difference % = 5%
If the plan total is zero, PMI leaves Difference % blank rather than producing a divide-by-zero result.
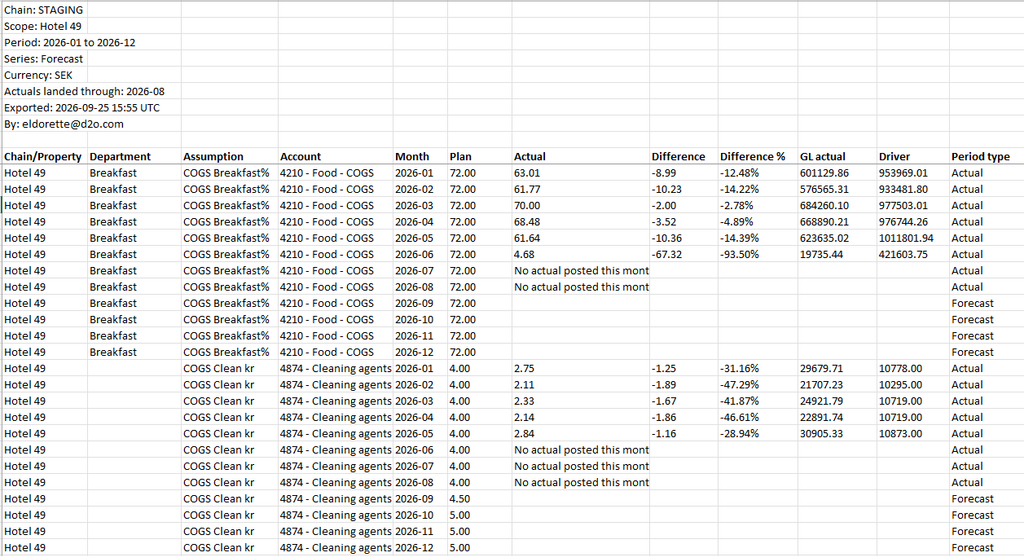
Plan vs Actual Summary with Plan, Actual, Difference, and Difference %
How the Ratio mix chart works
The Ratio mix chart shows the percentage share of each child assumption for each month.
Each column represents one month, and each section represents one child assumption.
The percentages shown in the chart are the same percentages PMI uses for the group’s starting values.
Locked months are shown as unavailable and are not given a calculated distribution.
Use Prev and Next to move through the months shown in the chart.
In summary
PMI calculates several values in Planning assumptions so you don’t have to calculate them manually.
The main calculated values are:
- Implied actuals from P&L formulas
- Variance against budget or forecast
- Historical starting distributions for assumption groups
- Fast-fill patterns
- Automatically filled new months (after 12 months or horizon month based on Express planner)
- Group percentage and amount totals
- Plan vs Actual export totals
The calculations are designed to show the underlying result without replacing your stored planning values. For example, formula-derived actuals are display-only and do not change your budget or forecast.