You can now understand how values in your P&L reports are built up directly from planning report view. This will let you view calculations and explore the data behind each line item without navigating away.
What’s new
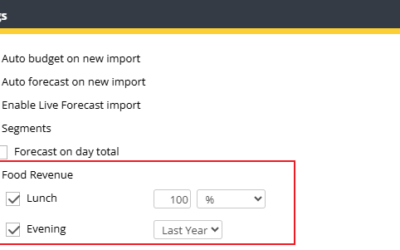
Two new view settings are available in P&L reports:
Show formula details in tooltip
- A calculator icon (🖩) appears next to value rows in standard P&L reports
- Hovering over the icon shows a tooltip with a quick overview of the calculation
- Clicking the icon automatically:
- opens the reports panel
- scrolls to the selected item
- expands the full calculation

Image: New View options with Calculator icon in the report
Show account level
- You can also expand report rows (+) to:
- view underlying accounts contributing to the value
- see how totals are built up across departments, hotels, or other dimensions
Note: This functionality is not available in group views.

Image: Expand button to see accounts details
Benefit
Quickly understand where numbers come from—whether reviewing formulas or validating underlying data—without switching to other views like Accounts or Account Summary
Cross-reference:
For more details regarding this enhancement see How to modify a P&L report