
What is Pickup Statistics?
Pickup Statistics helps you understand how your On the books (OTB) figures change over time.
It shows how much business was already booked at different points in time, allowing you to see how bookings have developed, identify changes in demand, and understand which dates and segments are driving the results.
Whether you are reviewing Rooms, Food, Beverage, Spa, or another department with On the books data, Pickup Statistics gives you a way to monitor booking patterns and compare performance against last year, budget, or forecast.
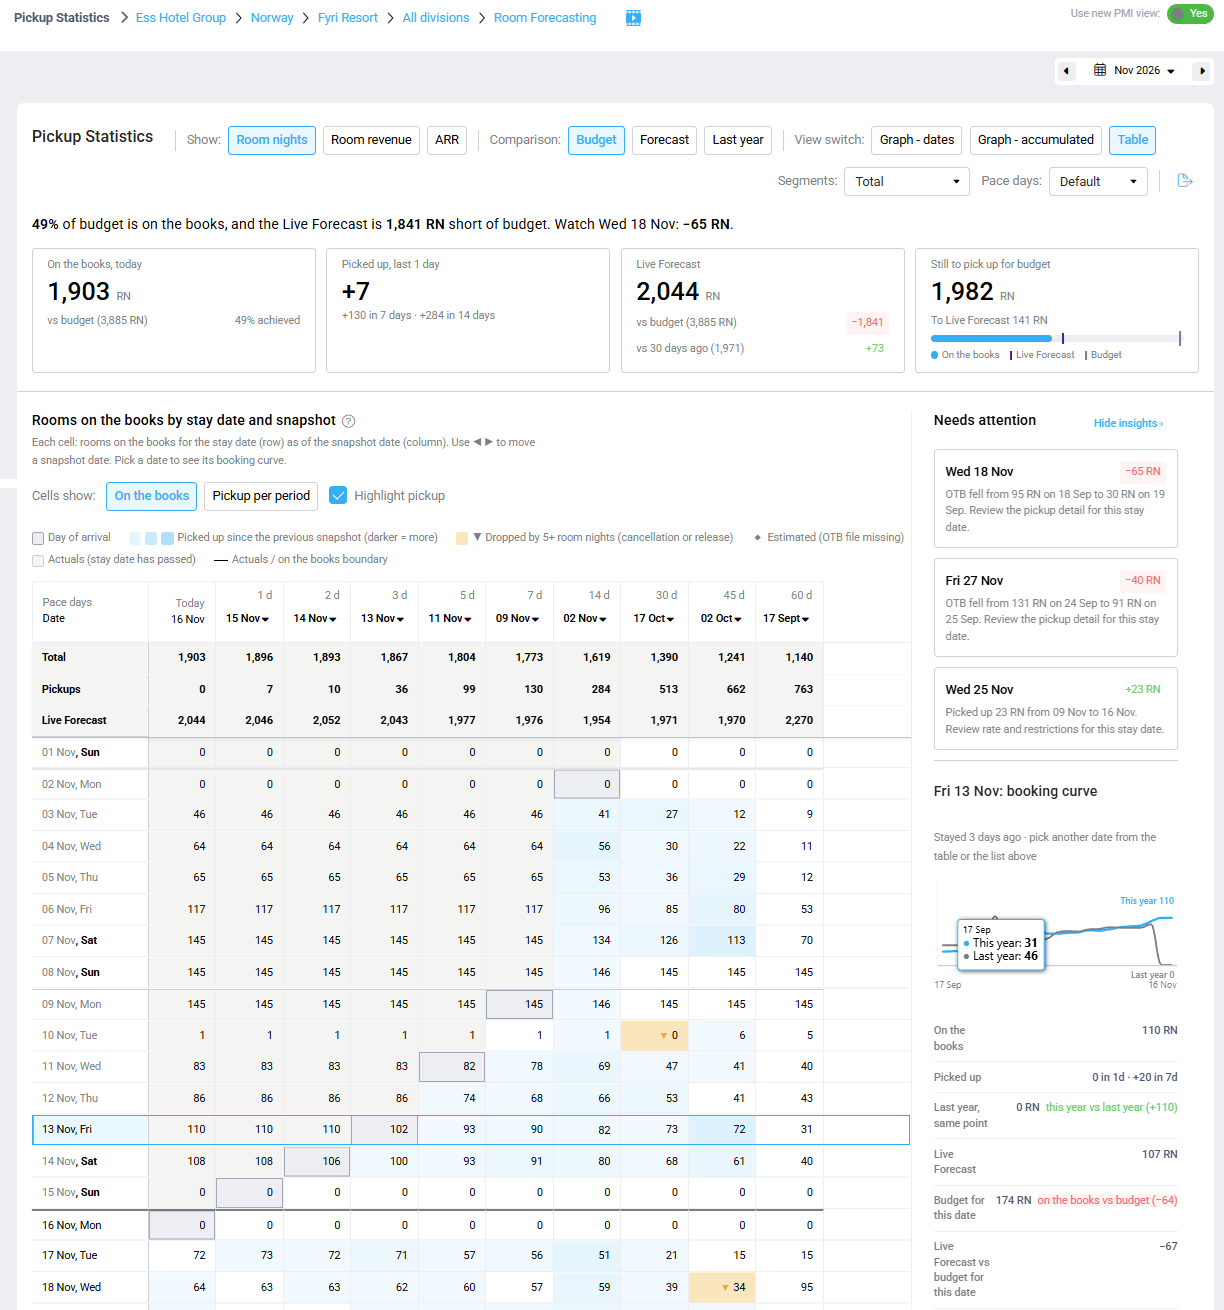
Full Pickup Statistics page with the summary cards, main table, and Needs attention panel.
Why use Pickup Statistics?
Understanding how bookings develop is an important part of effective forecasting. A single OTB figure tells you where you stand today, but looking at previous booking positions helps you understand how you got there.
With Pickup Statistics, you can:
- Monitor booking pace: See how much business was on the books at different points before the stay date.
- Identify changes: Spot dates where bookings have increased or decreased.
- Understand booking patterns: Compare different segments and investigate where changes are coming from.
- Compare performance: Measure your current booking position against last year, budget, or forecast.
- Identify dates that need attention: Use the Needs attention panel to find significant booking movements and changes in forecast.
- Support forecasting decisions: Use historical booking patterns and current OTB figures to review your expectations in Live Forecast.
What does Pickup Statistics show?
The page brings together several ways of looking at your booking position from a selected point of time.
Summary information
At the top of the page, you will find a summary sentence and up to four summary cards highlighting the overall position for the selected period.
The cards show:
- On the books: The current booking position compared with your selected reference.
- Picked up: How much additional business has been booked over selected periods.
- Live Forecast: The expected final result compared with your target and previous forecast.
- Still to pick up: How much additional business is needed to reach the target, and how much the forecast exceeds the current OTB position.
The fourth card is not displayed when viewing ARR or Average, as the concept of additional business to pick up does not apply to a rate.
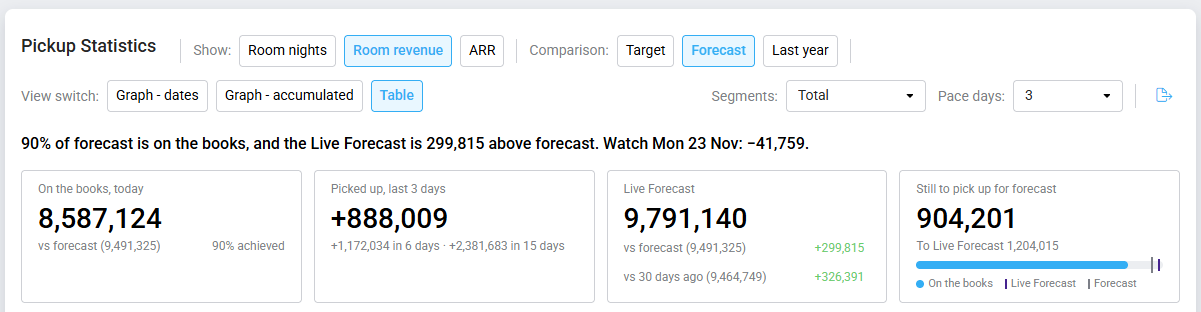
Pickup statistics showing the summary sentence and four summary cards.
Booking information
The main table shows your booking position for each stay date across several snapshot dates. This allows you to see how the figures have developed over time.
You can also switch between three display options:
- Table: View the detailed figures for each stay date and snapshot.
- Graph – dates: See how the booking position and pickup vary across the dates in the selected period.
- Graph – accumulated: Compare the accumulated booking position over time, including last year’s figures.
Needs attention and booking curve
The Needs attention panel highlights dates with significant booking movements or changes in forecast, helping you identify where further investigation may be needed.
Select a date to open its booking curve. This gives you a closer look at how bookings for that particular date have developed over time, including the current OTB position, pickup, last year’s position, Live Forecast, and budget where available.
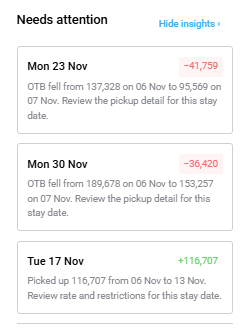
Needs attention panel
Available measures
The measures available depend on the department you select.
For Rooms, you can choose:
- Room nights: The number of rooms booked.
- Room revenue: The revenue generated from booked rooms.
- ARR: Average room rate.
For other departments, the corresponding measures are:
- Covers: The number of covers booked.
- Revenue: The revenue generated.
- Average: The average value per cover.
Who can use Pickup Statistics?
Users need Read access to the Pickup Statistics module, and the module must be enabled for the relevant hotel.
Contact your PMI administrator if you cannot access the module.
Getting started
Open Pickup Statistics from the PMI R&P menu.
Use the breadcrumb navigation at the top of the page to select the relevant group, hotel, and department. You can then choose the period and measures you want to review.
For a more detailed explanation of the available settings and how to interpret the information, see How to use Pickup Statistics.