Clearer visibility of actual performance against the SMART hours in Cockpit

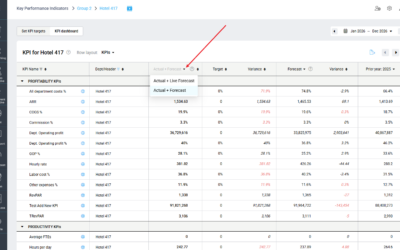
You can now see more easily how your actual performance compares to your SMART forecast directly in the Cockpit, for both hours and labor cost. A new comparison bar highlights the difference, making it even easier to spot where performance is above or below your target.

Why is it useful?

Easier to see whether teams are performing well compared to the ideal SMART plan, without having to do manual calculations.

Availability

Available to all PMI users with access to Cockpit.

Learn more

See the Labor cockpit summary graph for more details.

Image description: A new bar to the left  in the graph indicates the comparisson of actual performance vs SMART hours

Share this article!

You may also like…

Updated PIA chat experience

Updated PIA chat experience

We have released an updated version of PIA Chat designed to make it easier to use alongside your daily work in PMI....

Never miss an update

Never miss an update

To help you stay informed about the latest PMI improvements, PIA will notify you whenever new release notes are...