
SMART is a monthly forecast based on the productivity/hours forecast set (How is SMART calculated?). It identifies historical trends to suggest how many hours should be scheduled each day in order to meet the monthly productivity/hours forecast.
SMART uses historical patterns to distribute hours toward the monthly productivity/hours forecast. These patterns do not necessarily represent ideal staffing. Check the suggested hours against current workload and service standards. A blank departures ratio does not mean departure cleaning requires no work that day.
The primary cost driver is part of the monthly productivity/hours calculation. The daily allocation depends on the SMART mode. With machine learning (ML), the selected drivers and ratios can differ by weekday and season and can use activity from another day. These drivers may include sources not shown as the cockpit’s primary driver; do not assume the daily pattern follows that driver’s same-day revenue alone. When ML is enabled, users with the relevant d2o/HQ administrator access can inspect Tools > SMART drivers. The SMART legend tooltip identifies whether only the primary cost driver is being used.
Since SMART does not only use the primary cost driver for a specific day, it is not always easy to understand why SMART has suggested the hours that it has for that day.
Use SMART in the coaching review
First confirm the department, dates, selected season, workload drivers and monthly productivity/hours forecast. Compare SMART with the corresponding productive hours, and review paid nonproductive categories separately using the report’s definitions.
Ask whether the concern is the demand input, the allocation between days, the monthly allowance or a constraint such as Min/Max hours. A flat or zero SMART value is a signal to check the setup and operating dates; it is not, on its own, proof that a productivity forecast is missing.
The HOD checks service coverage and proposes an operational response. The forecasting owner resolves a disputed demand assumption, and the GM or authorised owner reviews an unrealistic plan or required exception. Historical patterns can preserve inefficient practices, so assess current workload and service standards as well as historical fit.
After an agreed change, review actual workload, productive hours and available service results over comparable days. A closer match to SMART alone does not prove that service improved or payroll fell. Use Reviewing staffing against demand and service requirements for the action and follow-up routine.
What do the SMART driver ratios mean?
The ratios in the SMART drivers table are calculation coefficients. For each selected driver, PMI multiplies the relevant driver value by its ratio to calculate an hours contribution. It adds the contributions from the selected drivers for that day. This is an intermediate calculation: limits, fallback rules and the subsequent SMART allocation can affect the final hours shown in the cockpit.
For example, if a departure driver has a ratio of 0.20 and its input is 100 departures, its contribution to that calculation is 20 hours. This is an illustrative example, not a recommended ratio. It does not mean that each departure room should take 12 minutes to clean: other drivers can also contribute to the same day’s hours, and the final SMART hours can be adjusted.
A ratio is not a percentage, a share of the day’s hours or a correlation score. The ratios do not need to add up to 1 or 100%. Do not compare their size alone to decide which driver matters most; its input volume, unit and day offset also matter.
Why do drivers and ratios differ by weekday?
SMART uses historical relationships between activity and productive hours. The drivers and ratios are stored by weekday and seasonal period, so the selected combination for a Monday can differ from the combination for a Sunday. Read the selected season and the full driver label: a row marked “1 day before” uses activity from the previous day, rather than the same day’s activity.
These differences reflect the historical patterns used by the model; they are not a rule that the same cleaning task should take a different amount of time on different weekdays. A blank cell does not mean that the associated work takes no time. It means no non-zero ratio is displayed for that driver and weekday in the selected period. Very small ratios may be displayed as <0.001.
Does SMART allow for departure rooms taking longer to clean?
Departures can contribute to the calculation, directly or through a configured cost driver. However, SMART is not a room-by-room cleaning-time calculator with a fixed allowance for departures and another for stayovers. A departure row in the table shows that departures contribute where a ratio is present; it does not by itself prove that the resulting hours meet the department’s current cleaning requirements.
Also distinguish the daily pattern from the monthly hours allowance. SMART allocates hours against the monthly productivity/hours forecast and the applicable settings. Including departures in the daily pattern does not automatically increase the monthly hours allowance sufficiently for a change in cleaning workload.
If departure-heavy days appear to have too few hours, compare several such days with days that have similar occupancy but more stayovers. Check the departure, stayover and room-night figures and their dates; the selected SMART drivers and season; SMART, scheduled and actual productive hours; and the monthly productivity/hours forecast, locked-target setting and Min/Max hours. Confirm whether the historical staffing pattern still reflects the hotel’s cleaning standards and operating practices.
Use the comparison to establish whether the concern is about the workload data, the distribution of hours between days or the overall monthly allowance. Review the findings with your BRE/Adoption contact before deciding that a driver or productivity target needs changing. A screenshot of the ratios alone cannot establish the cause.
Example 1: Primary cost driver increases but SMART hours decrease
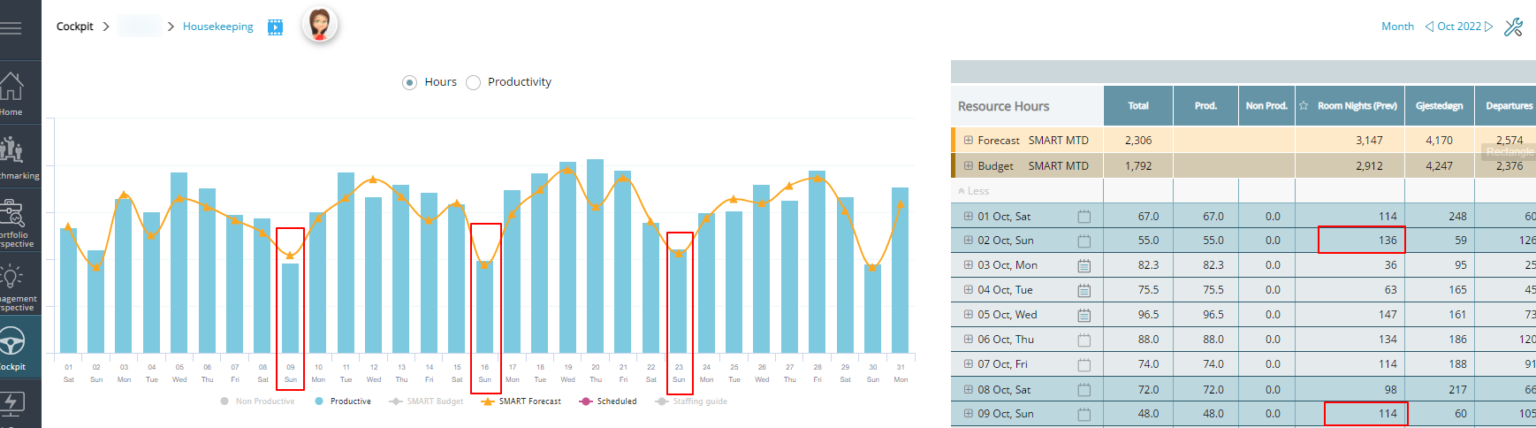
The above Housekeeping department uses ‘Room Nights (Previous day)’ as their manual primary cost driver. Looking at the graph, you can see the SMART forecast always forecasts a drop in hours each Sunday. However, in the table, the primary cost driver increases every Sunday.
This is a pattern that SMART has recognised from the past. SMART looks at the last 365 days, disregarding any outlier days. Housekeeping usually staffs less on Sundays, and cleans rooms from the weekend on Monday. SMART will recognize such trends and schedule the future using a similar pattern to what was done historically.
Note: If there is a significant change in how staff are being scheduled, due to a restructure, for example, it will take some time before SMART recognizes the new pattern. Therefore, department heads should use SMART as a starting point for how to allocate hours over the month to reach the forecasted goal. There will always be factors that SMART cannot predict.
Example 2: No clear correlation between Primary cost driver and SMART hours
In the above Meeting & Events cockpit, you can see a sharp decrease in hours during the first week of the month. This contrasts with the primary cost driver in the table, which is showing an increase of M&E revenue during the week.
It may be that SMART has identified other drivers with a higher correlation for this period. For example, it may have identified that 2 days before an event, there is usually more hours scheduled (for set-up preparations) and during an event, less hours are needed. Or perhaps not all revenue is usually posted on the day of the event, but a day or two after, and therefore hours are needed before the revenue is reported.
As SMART is looking at many factors, it is not always possible to pinpoint exactly why that many hours were forecast for a specific day. It is, however, a useful guide based on historical trends and can help get staffing at an appropriate level.
Example 3: Cost driver Live forecast is not accurate
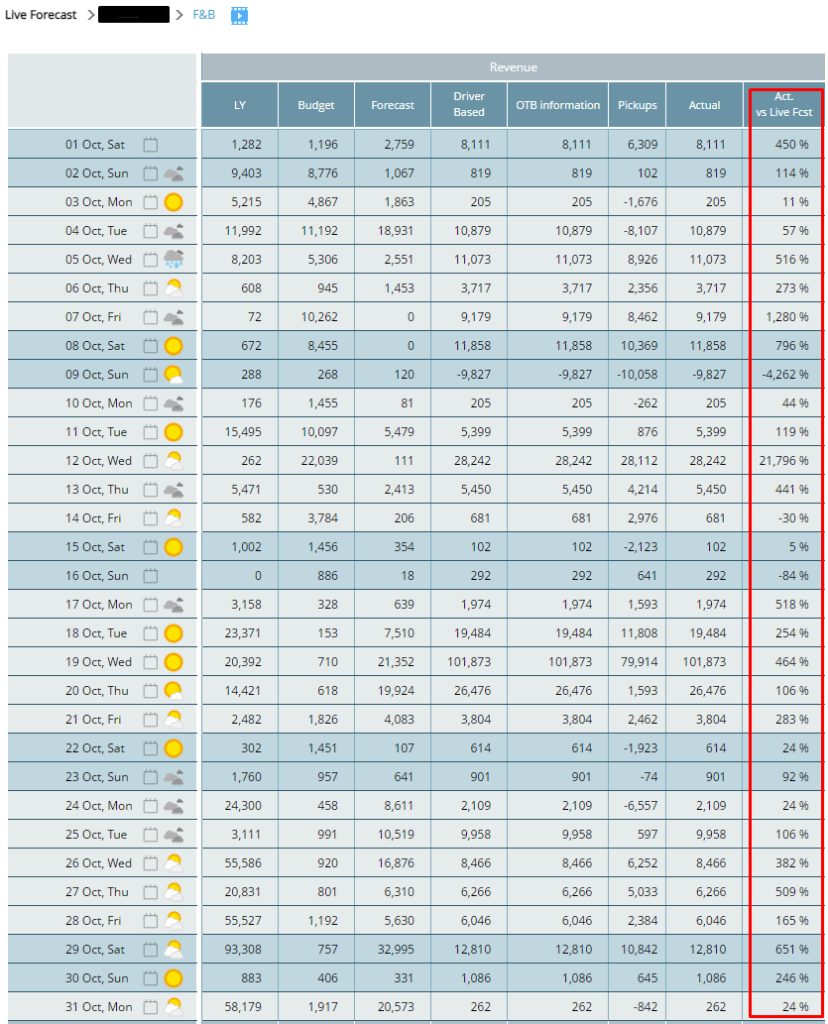
A difference between actual revenue and Live Forecast is a reason to review the inputs, but it does not by itself establish which drivers SMART selected. First check whether the cockpit uses only the primary cost driver or an ML allocation. In ML mode, inspect the selected drivers, weekday/season and date offsets before attributing an unexpected daily pattern to forecast accuracy.
The example below shows a large deviation between Actuals and Live Forecast. Keep actual-revenue corrections separate from Live Forecast edits when investigating such a case. If the figures were changed after the day passed, record the affected dates and update time. Do not assume the edit changes the actual revenue, immediately rewrites historical SMART, or explains the daily difference without checking the data and configuration.
Example 4: SMART Forecast consistently too low/high compared to actuals
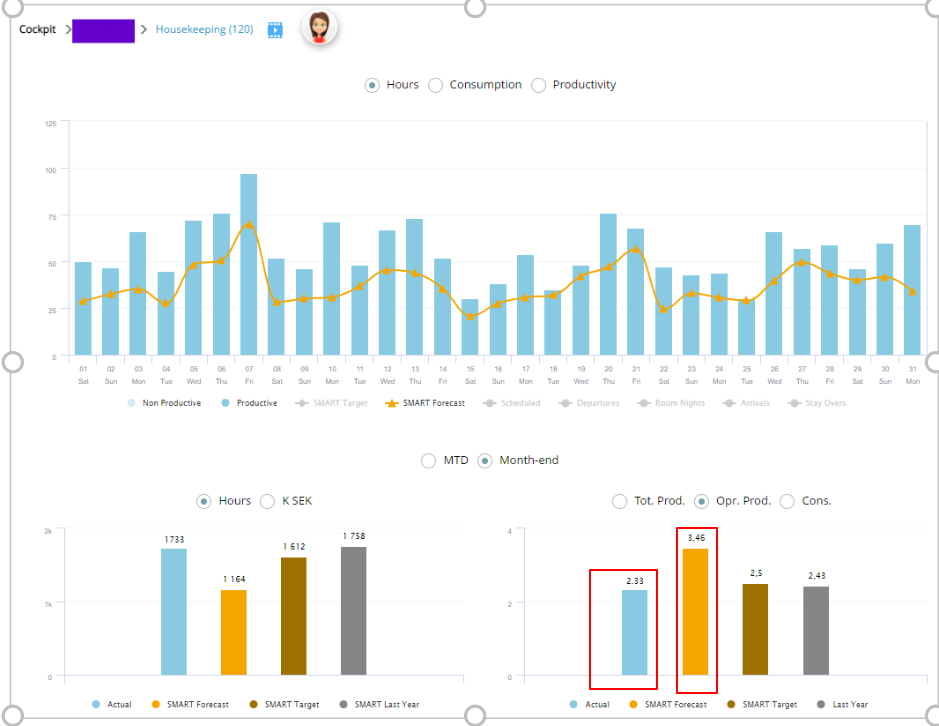
In the below graph, the SMART forecast is predicting considerably less hours than scheduled. This is because the productivity forecast is very high compared to actual productivity. SMART will always allocate hours based on the monthly productivity/hours forecast, which in this case is making the number of SMART hours suggested too low.
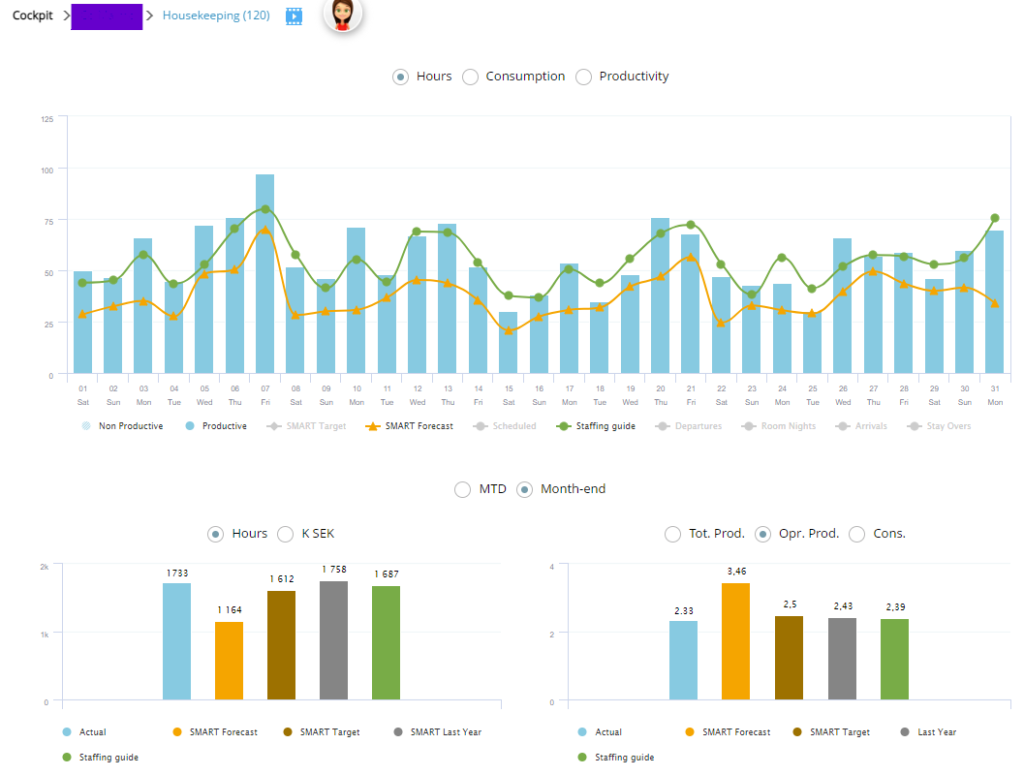
In instances where the hours/productivity forecast is unrealistic, the staffing guide will be a better guide on how best to schedule staff. The staffing guide uses historical trends to recommend hours based on what the department should be able to achieve. It does not take into consideration monthly forecasts or manual min/max settings.
Example 5: SMART always shows same hours each day
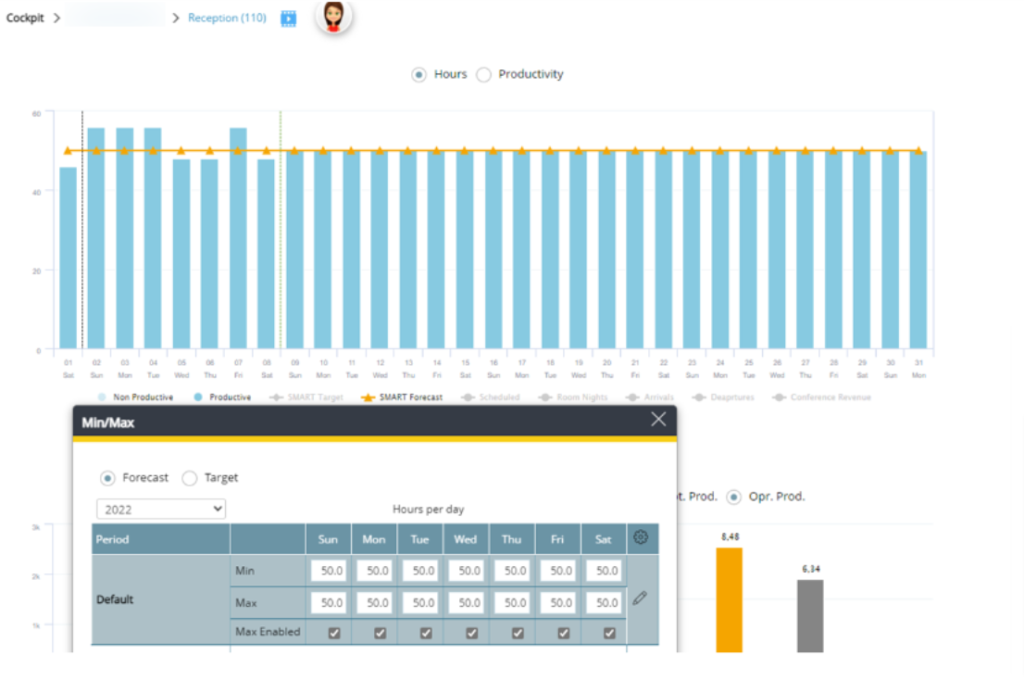
SMART forecast respects the manual min/max settings as set in Tools and Settings (this setting is visible dependent on user rights). If the setting is not set up correctly, it may distort the SMART forecast.
In the below example, min/max has the same values set for both minimum and maximum hours per day. This means that SMART has no flexibility. It will always schedule 50 hours per day regardless of activity levels at the hotel.
Example 6: SMART hours month total is different from monthly forecast
Min/max settings can, in some cases, prevent SMART from forecasting the same number of hours as the monthly forecast. In the below example, the month forecast is 176 hours, but due to the Min/Max settings, SMART can only allocate 168 hours for this month.
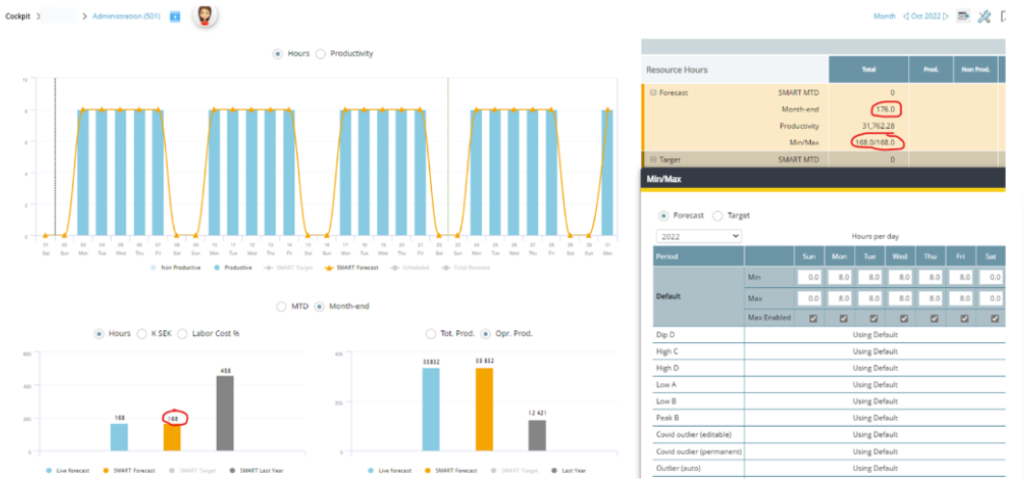
As SMART is based on past staffing patterns, it will recognize certain patterns, even if min/max values are not set. If min is set to 0 and max not enabled, the same department would get a daily allocated SMART as seen in the example below. Now the forecasted hours of 176 are allocated, and, depending on weekday and season, there has been a pattern of not using the exact same numbers of hours Monday-Friday:
Example 7: SMART allocates hours during a holiday when the property is closed
If a department is closed but SMART still allocates hours during the period, there can be two reasons:
- Limited historiсal data available
-
- SMART has a built-in detection of minimum and maximum staffing, but if not enough history is available to establish the levels, it uses yearly min/max values, i.e., what is most often used as min/max. If the department is then closed, it will still allocate minimum staffing based on the specific weekday.
-
- You have set a default min/max. This applies to all days in a year, including all holidays.
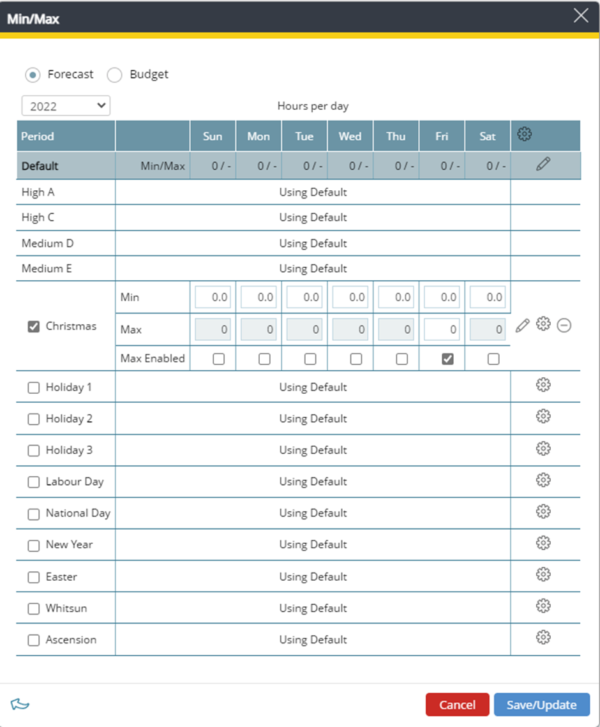
To resolve this, you can set a manual min/max staffing for the holidays. Open the cockpit tools and click on ‘Min/Max Hours Per Day’. Select the holiday in question and click on the pencil to edit. For the weekdays you will be closed, enable max hours, and set the maximum staffing to 0, then save.
SMART always follows manually set min/max hours, and will now allocate 0 hours on those days.
Investigating unexpected daily variation
Compare the same dates using the labelled daily SMART Forecast tooltips and the matching driver values. Daily SMART, actual or planned productive hours, and Resource Hours monthly totals are different values. Review the allocation mode, selected drivers and date offsets, monthly productivity/hours forecast and Min/Max settings. A difference is a reason to investigate, not an instruction to change staffing.
See Why do SMART Forecast hours vary when revenue is similar? for the evidence to collect.