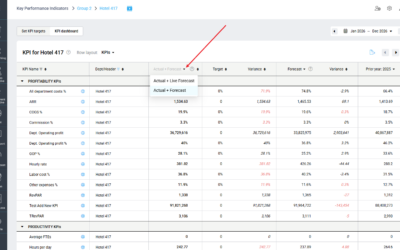
The RevPOLU overview column chart now displays variance percentages showing how Actual/Live forecast month-end (current month actual MTD + live forecast) compares to Forecast, Budget/Target, and Last year.
Variances are color-coded to highlight performance — green when Actual/Live forecast outperforms the comparison, and red when it underperforms — with tooltips clarifying each comparison.

Image: Variances (in brackets) vs Actual/live forecast ME