
What is PMI Live Forecast Accuracy?
PMI Live Forecast Accuracy helps you understand how accurately your hotel's Live Forecast and PMI Prediction estimate room demand.
The module compares the hotel's Live Forecast and PMI Prediction against the actual number of rooms sold. This allows you to see which of the two was more accurate and how large the difference was.
Current availability
The first release focuses on Rooms and compares:
- Live Forecast: The hotel's operational forecast, which may contain imported values, manual edits, revenue drivers or PMI predictions.
- PMI Prediction: PMI's own prediction of the number of rooms expected to be sold.
Both are compared against the actual number of rooms sold.
This release does not include Guest Nights or Rooms revenue.
Additional areas will be introduced in future releases:
- Ancillary revenue.
- Labor.
Accessing PMI Live Forecast Accuracy
Access to PMI Live Forecast Accuracy is currently limited to users with the HQ Administrator or HQ Controller role, following the existing legacy access logic.
The module must also be enabled for your property group. You will only see hotels you have access to that have a Rooms department.
To open the module:
- From the main menu.
- Select PMI Live Forecast Accuracy.
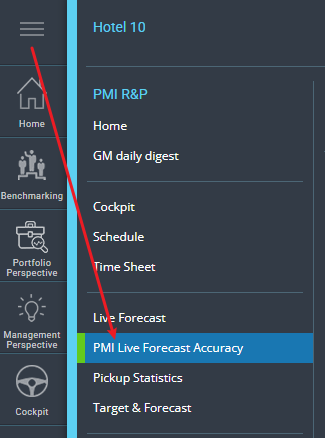
Image: Navigation to the PMI Live Forecast Accuracy
The new page replaces the previous Live Forecast Accuracy page by default. You can switch between the old and new views using the Use new PMI view switch.
To access the module, your property group must have the PMI Live Forecast Accuracy module enabled, and your user must have view access. Contact support@d2o.com for activation.
You will only see hotels you have access to that have a Rooms department.
Switching between the old and new page
You can switch between the old and new versions of PMI Live Forecast Accuracy. Your preference is saved per user.
To switch to the old page:
- On the new page, find the Use new PMI view switch in the page header.
- Turn it off.
- The old page opens once your choice is saved.
To return to the new page:
- On the old page, find the Use new PMI view switch in the menu bar.
- Turn it on.
- The new page opens once your choice is saved.
Good to know:
- If you have never selected a view, the new page opens by default.
- The main-menu item opens whichever page you last selected.
- When using the browser's Back button, PMI uses your saved view preference to determine which version of the page to display.
Selecting the hotels and period to analyse
Before reviewing the results, you can define which hotels and dates to include.

Group and property
Use the selectors at the top of the page to choose a group or individual property.
You can select:
- An entire group by leaving the property selection set to All.
- An individual property to review its results separately.
Period
The period defines the stay dates you want to analyse.
By default, PMI selects the last full calendar month. You can choose another date range, up to a maximum of 12 months.
Snapshot date
The snapshot date determines which stored values are used for the comparison.
Think of it as asking: How accurately did the Live Forecast and PMI Prediction estimate room demand based on the information available on this particular day?
For example, you might want to understand how accurately the hotel estimated its room sales 30 days before arrival.
By selecting an earlier snapshot date, you can review the Live Forecast and PMI Prediction as they were at that point in time, rather than looking only at the latest values.
The snapshot date must be before the last day of the selected period and cannot be later than today.
Important: PMI uses the same stored snapshot for both the Live Forecast and PMI Prediction at each hotel. This ensures that they are compared using information available at the same point in time.
Understanding the summary cards
The page contains three summary cards:

Live Forecast
Shows how accurately the hotel's Live Forecast predicted the actual rooms sold.
PMI Prediction
Shows how accurately PMI Prediction estimated the actual rooms sold.
Difference
Shows the difference between the daily accuracy of PMI Prediction and the Live Forecast.
A positive difference means PMI Prediction was more accurate. A negative difference means the Live Forecast was more accurate.
The card also indicates how many rooms per day PMI Prediction missed less (or more) than the Live Forecast.
Good to know: While data is loading, the cards are temporarily blanked out. This follows the loading behaviour used on other PMI pages. Your filters remain usable while the data loads.
Daily accuracy and period accuracy
Both the Live Forecast and PMI Prediction cards display two accuracy measurements:
- Daily accuracy: Measures how accurately each value predicted rooms sold across individual days. Overestimating and underestimating both count as errors.
- Period accuracy: Compares the total number of rooms estimated with the total number of rooms actually sold over the selected period. Overestimating and underestimating can cancel each other out.
This means period accuracy can be higher than daily accuracy.
For example, if the Live Forecast estimates 110 rooms on one day and 90 rooms on another, while the hotel actually sells 100 rooms on both days, the total is correct. However, the daily estimates were not accurate.
PMI highlights the more accurate result in gold and displays a More accurate indicator.
The daily and period accuracy results are evaluated separately, so the highlighted result may differ between the two measurements.
Understanding the Live Forecast source
The Live Forecast source bar shows where the Live Forecast values came from on the days included in the analysis.

This helps you understand how the Live Forecast was created and whether it was primarily based on imported data, manual adjustments or PMI Prediction.
The bar uses different colours to represent the available sources. The percentage for each source represents its share of the counted hotel-days.
Sources can include:
- PMI prediction: PMI's prediction was copied into the Live Forecast.
- PMI prediction, no history: PMI Prediction was used, but PMI had no history to work from.
- PMI prediction, little history: PMI Prediction was used, but PMI had little history available.
- PMI prediction, not refreshed: The Live Forecast contains an older PMI prediction that no longer matches the PMI Prediction stored in the selected snapshot.
- Manual edit: A user manually entered the Live Forecast value.
- Revenue driver: The Live Forecast value came from a revenue driver.
- Imported: The value came from the hotel's forecast file.
- PMI, info: no history: PMI informational status indicating no history.
- PMI, low confidence: PMI alert indicating low confidence.
- PMI, not enough data: PMI alert indicating insufficient data.
- PMI, aggregated data alert: PMI alert related to aggregated data.
- Invalid forecast: The stored Live Forecast value is invalid.
You can hover over a section of the bar to see the number of hotel-days represented by that source.
This information can help you investigate why the Live Forecast performed well or poorly. For example, you may want to look more closely at hotels where the Live Forecast relies heavily on manual adjustments or imported values.
Comparing accuracy by hotel
The Accuracy by hotel table provides a breakdown of the results for each selected hotel.
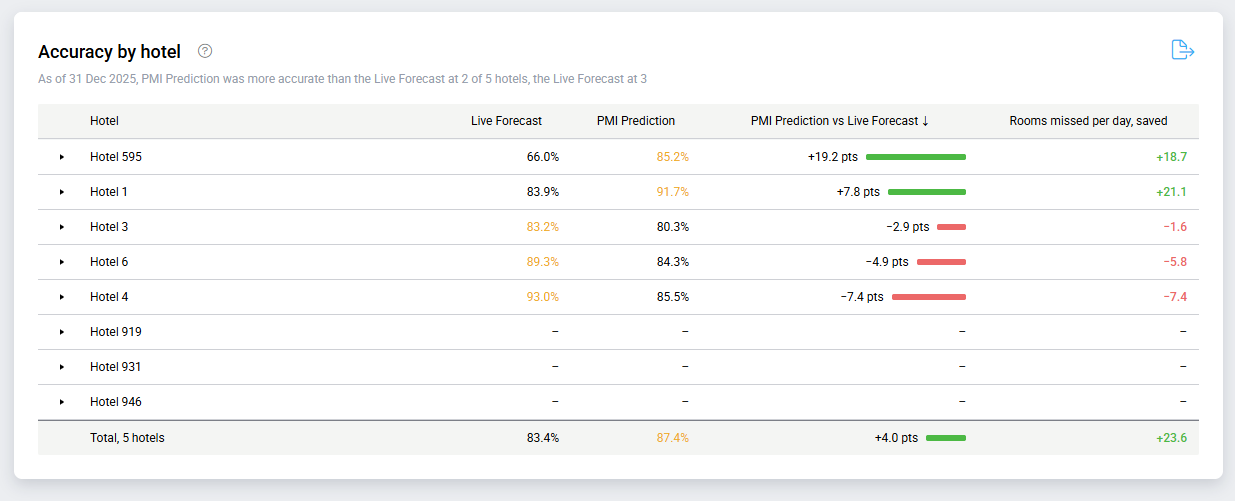
For each hotel, you can see:
- Live Forecast: Daily accuracy of the hotel's Live Forecast.
- PMI Prediction: Daily accuracy of PMI Prediction.
- PMI Prediction vs Live Forecast: The difference in accuracy points between the two.
- Rooms missed per day, saved: How many fewer (or additional) rooms PMI Prediction missed per day compared with the Live Forecast.
The table uses colours to make the comparison easier:
- Green indicates that PMI Prediction was more accurate.
- Red indicates that the Live Forecast was more accurate.
- Same means the difference is below 0.05 rooms. It indicates that the difference is small enough to be considered equal.
You can sort the table by clicking a column header. By default, hotels are sorted by the difference in accuracy, with the largest difference first.
The Total row summarises the results for all selected hotels and matches the summary cards.
Good to know: The number of hotels shown in the Total row (Total, N hotels) only counts hotels with available data. Hotels showing a dash (–) are excluded. This means N can be smaller than the total number of hotels displayed in the table.
Investigating individual hotel days
To understand where differences between the Live Forecast and PMI Prediction occurred, you can expand a hotel in the Accuracy by hotel table.
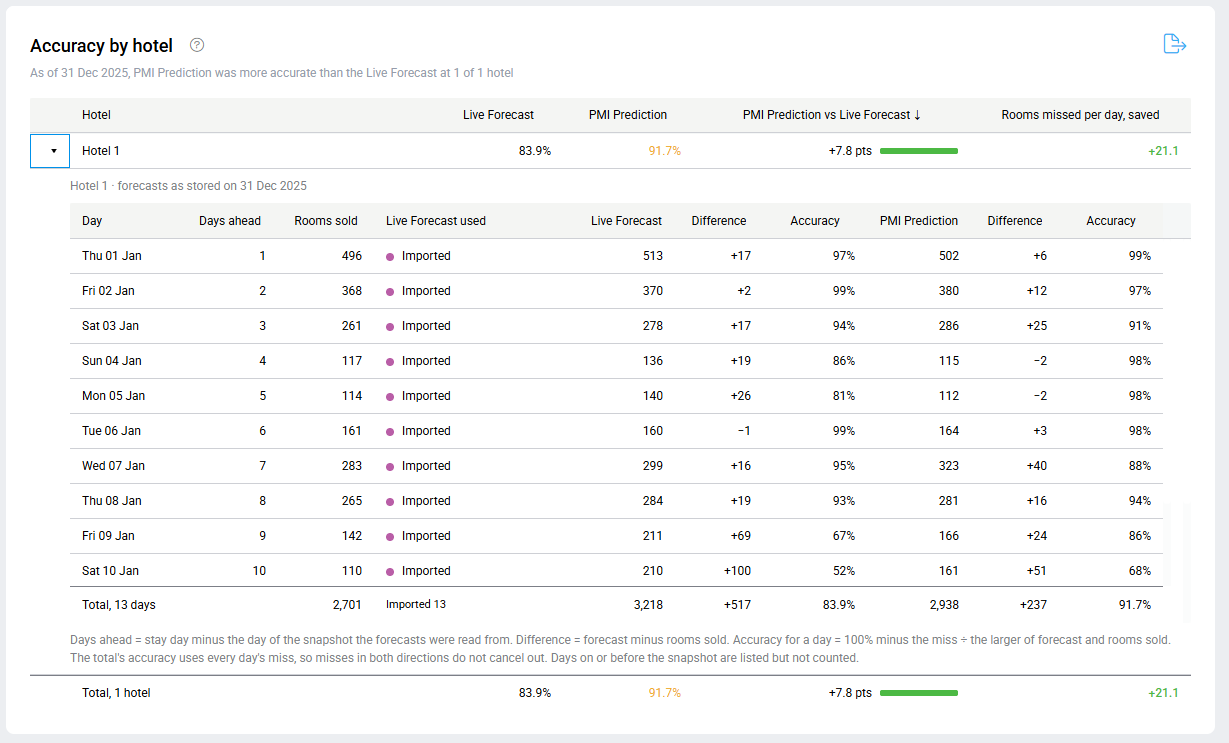
This opens a daily breakdown showing both values alongside the actual rooms sold.
The table includes:
- Day: The stay date.
- Days ahead: The number of days between the snapshot date and the stay date.
- Rooms sold: The actual number of rooms sold.
- Live Forecast used: The source of the Live Forecast for that day.
- Live Forecast / PMI Prediction: The estimated number of rooms from each.
- Difference: The difference between the estimated rooms and actual rooms sold.
- Accuracy: How close each value was to the actual rooms sold.
A positive difference means the estimated number of rooms was higher than the actual rooms sold. A negative difference means it was lower.
You can expand several hotels at the same time to investigate their daily results.
Good to know:
- The day table only lists days for which rooms sold data is stored. It does not necessarily display every day in the selected period.
- Days on or before the snapshot date are displayed but are not included in the accuracy calculations.
- Days with zero rooms sold are not included in the accuracy calculations.
- If a hotel has several Rooms departments, their figures are combined.
Exporting data
You can export the information from the page to either Microsoft Excel or Google Sheets for further analysis or sharing.
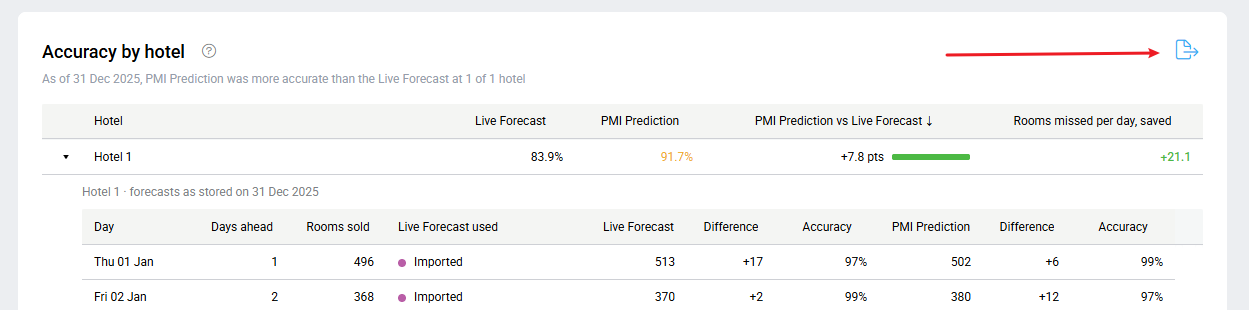
To export the data:
- Click the Export data icon on the Accuracy by hotel card.
- A popup opens with two options: Microsoft Excel and Google Sheets.
- Select your preferred format to export the data.
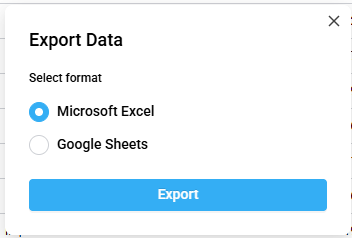
The export includes:
- Selection: The selected chain, group, property, period and snapshot date, together with the summary figures and Live Forecast source split.
- By hotel: The hotel comparison table, including the total row.
- Days: The daily breakdown for hotels that were expanded when the export was created.
Hotels that are not expanded are not included in the Days sheet.
How PMI calculates forecast accuracy
PMI uses the same set of days when comparing the Live Forecast and PMI Prediction.
A day is included in the calculations when:
- It is after the selected snapshot date.
- Actual rooms sold are greater than zero.
- Both the Live Forecast and PMI Prediction are available.
Day accuracy
Day accuracy measures how close the Live Forecast or PMI Prediction was to the actual rooms sold on an individual day.
PMI calculates the difference between the estimated rooms and actual rooms sold, ignoring whether the estimate was too high or too low.
The difference is divided by the larger of the estimated or actual number of rooms. The result is then subtracted from 100%.
Example:
If the Live Forecast estimates 220 rooms and the hotel actually sells 212 rooms:
- Difference: 8 rooms.
- Error percentage: 8 ÷ 220 = 3.6%.
- Accuracy: 96% (rounded to a whole percentage).
Daily accuracy and period accuracy
Daily accuracy measures the combined errors across individual days. Overestimating and underestimating both count as errors.
Period accuracy compares the total estimated rooms with the total actual rooms sold over the selected period. Overestimating and underestimating can cancel each other out.
For this reason, period accuracy is never lower than daily accuracy.
Example:
The hotel sells 100 rooms on each of three days.
The Live Forecast estimates:
- Day 1: 110 rooms.
- Day 2: 90 rooms.
- Day 3: 100 rooms.
The results are:
- Daily accuracy: The total difference is 20 rooms. Daily accuracy is 93.5%.
- Period accuracy: The total estimated rooms are 300, matching the 300 rooms actually sold. Period accuracy is 100%.
Difference in accuracy points
The Difference card calculates the difference between PMI Prediction's daily accuracy and the Live Forecast's daily accuracy, using the unrounded values.
For example:
- PMI Prediction: 95.0%.
- Live Forecast: 93.1%.
- Difference: +1.9 percentage points.
A positive result means PMI Prediction was more accurate.
If the difference is less than 0.05 percentage points, PMI displays Same.
Rooms missed per day, saved
This figure shows how many fewer rooms PMI Prediction missed per day compared with the Live Forecast.
For example, if the Live Forecast missed 240 rooms and PMI Prediction missed 90 rooms over 30 days:
(240 − 90) ÷ 30 = 5 rooms per day saved.
This helps translate the difference in accuracy into a more practical measure.
Frequently asked questions
Q.Why does a hotel show no accuracy result (–)?
A.This means there are no days available for the comparison. This may be because no snapshot contains both the Live Forecast and PMI Prediction, there are no days after the snapshot date, or there are no days with actual rooms sold.
Q.Why is the day count on the summary cards higher than the number of days in my selected period?
A.Each day is counted once for every hotel. For example, 3 hotels over 30 days can result in 90 counted hotel-days.
QWhy can period accuracy be higher than daily accuracy?
A.Period accuracy compares the total estimated rooms with the total rooms sold. Overestimating on one day and underestimating on another can cancel each other out. Daily accuracy counts both errors separately.
Q.Why is PMI Prediction sometimes identical to the Live Forecast?
A.When PMI Prediction has been copied into the Live Forecast, both contain the same value. This is expected.
QDoes the current release include Guest Nights or Rooms revenue?
A.No. The first release focuses on the number of rooms sold. Guest Nights and Rooms revenue are not included yet.
Q.Will other areas be included in PMI Live Forecast Accuracy?
A.Yes. The module will be expanded in stages. Guest nights, Rooms Revenue and ARR, Ancillary revenue, followed by labor in future releases.