Objective
Time Sheet brings labour-cockpit hours together so managers can review the property’s staffing picture. Use it to compare recorded and planned hours across departments and identify where a closer cockpit review is needed.
Heads of department, management teams and human resources can use the report as a shared starting point for a staffing discussion.
Check completeness before comparing
The report depends on hours being updated and saved in the underlying cockpits. Before a daily review, check that yesterday’s hours have been completed. An apparently favourable total can be misleading if one department is missing data.
Time Sheet is a management summary. Investigate the underlying cockpit before treating a difference as a staffing performance issue.
Choose the information you need
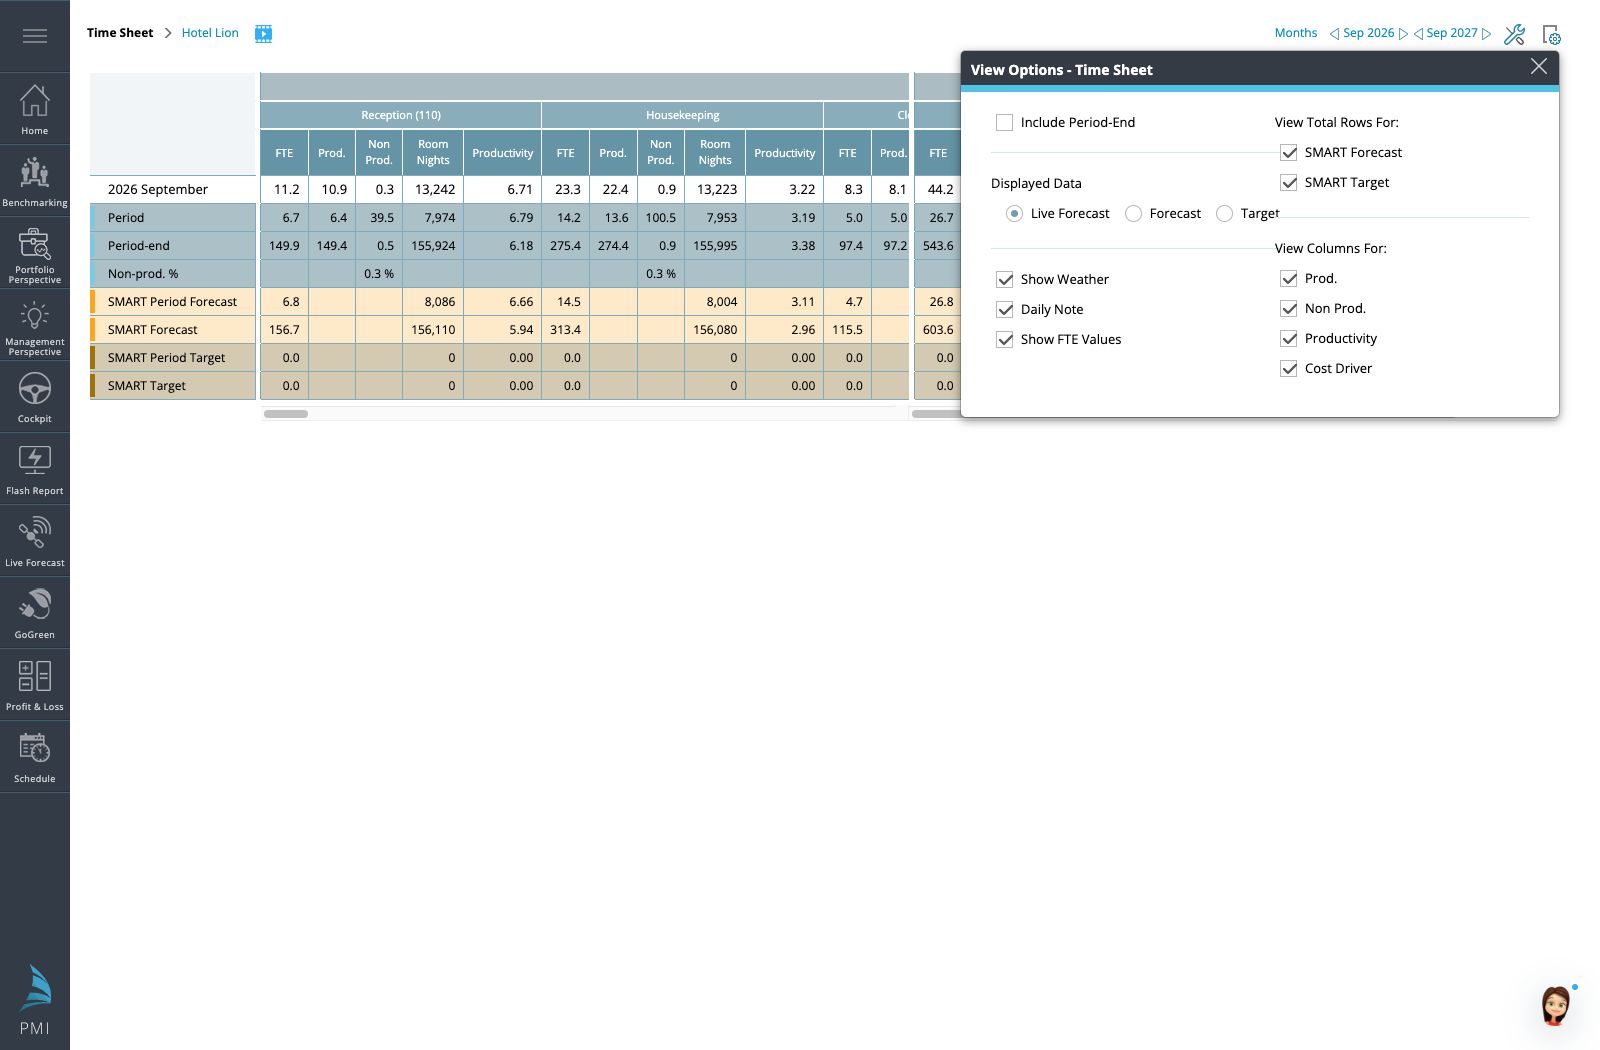
Open Time Sheet from the main menu and select the property and period. In View Options, select the comparisons and columns appropriate to the review.
- Include Period-End: include the Live Forecast in the report.
- View Total Rows For: add SMART Forecast and/or SMART Target comparison totals (labels may vary by version).
- View Columns For: choose productive hours, non-productive hours, productivity and cost driver.
- Daily Note: display notes that may explain an unusual day.
- Show Weather: display weather information where available.
Month-to-date figures describe the elapsed part of the month; period-end information extends the discussion to the expected full-period result. Keep those horizons separate when discussing whether a department is on track.
Run a daily or weekly review
- Confirm the property, period and data completeness.
- Select the hours and comparison columns you need.
- Look at department figures before drawing conclusions from the property total.
- Identify dates or departments with a material difference.
- Review the cost driver and daily notes for context.
- Open the relevant cockpit to investigate hours, demand and planning assumptions.
- Agree an action and check its effect in the next review.
Departments may use different cost drivers. A divisional or property total is not simply a like-for-like productivity comparison between all departments. Use each measure in its stated context.
Example
Demo Hotel A appears below its expected labour hours for yesterday. The manager discovers that Kitchen hours have not yet been saved. After the cockpit is completed, the summary gives a different picture. The team then reviews the genuine variance rather than treating missing data as improved productivity.
Resolve a mismatch with a cockpit
Check that both views cover the same period and department and use the same comparison. Confirm that the cockpit hours were saved. Review whether productive and non-productive hours, period-end values or other display options differ.
Export a review copy
Use Tools to export to Excel or PDF where available. Include the reporting period, selected comparisons and data-completeness notes when sharing the report.
Related information
View examples
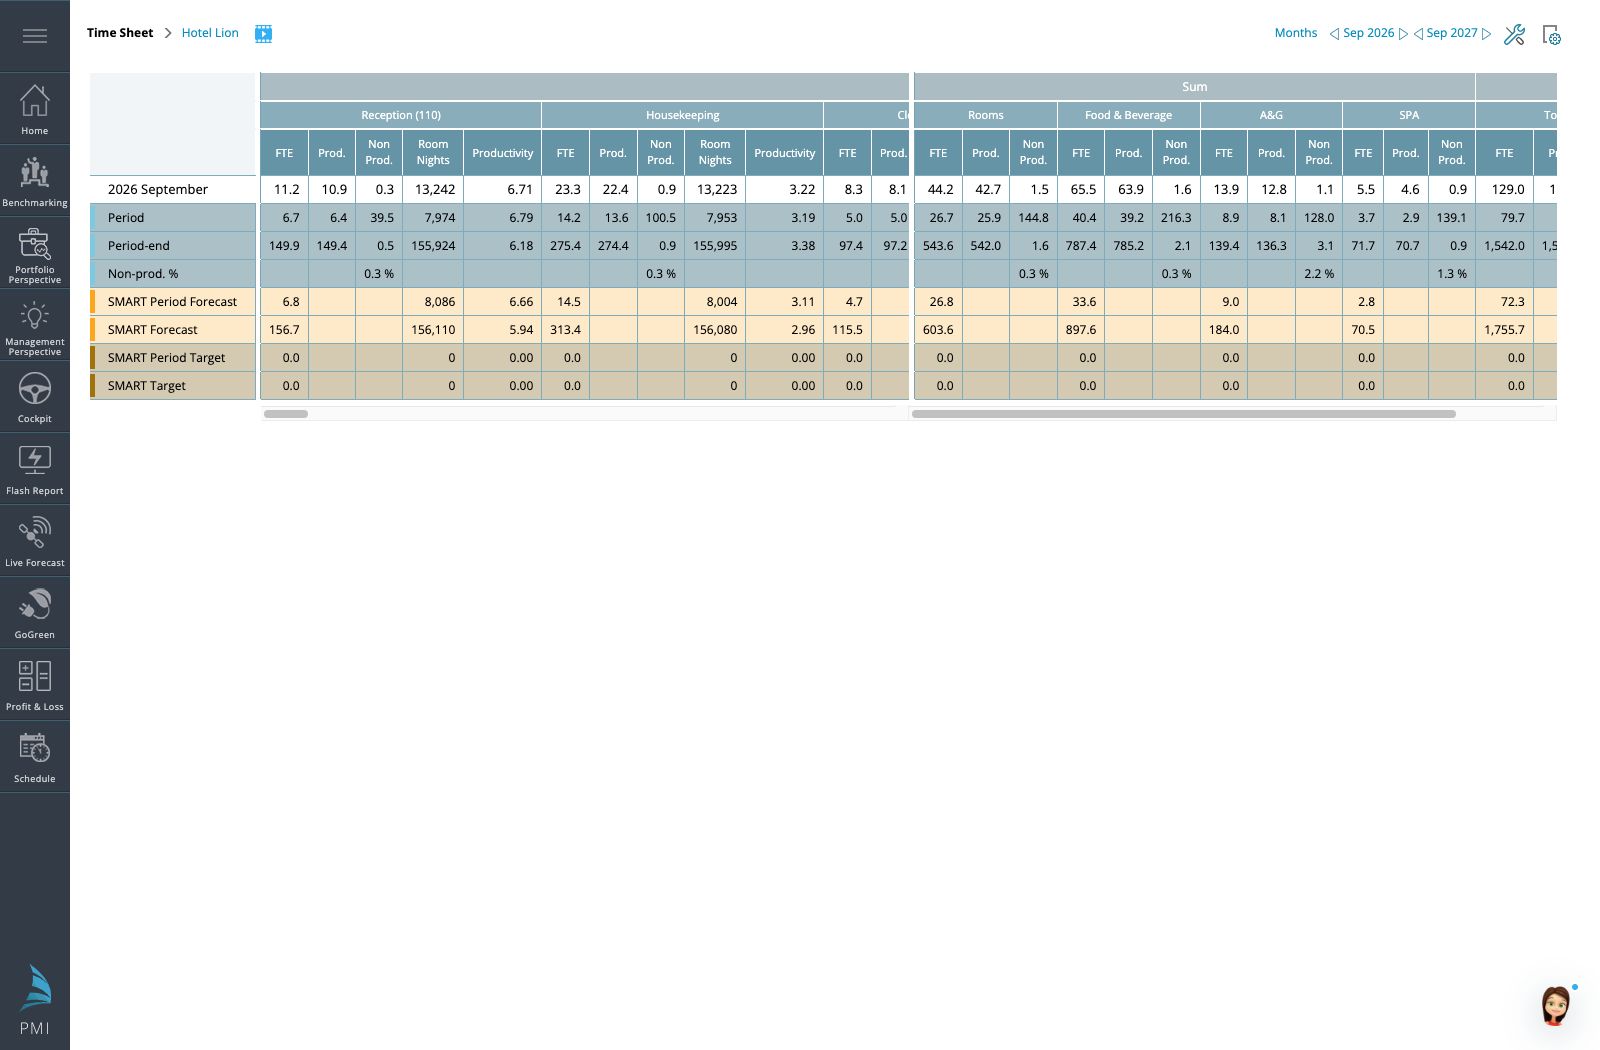
Figure 1. Time Sheet with department column groups and comparison totals. Scroll horizontally to see further departments.