
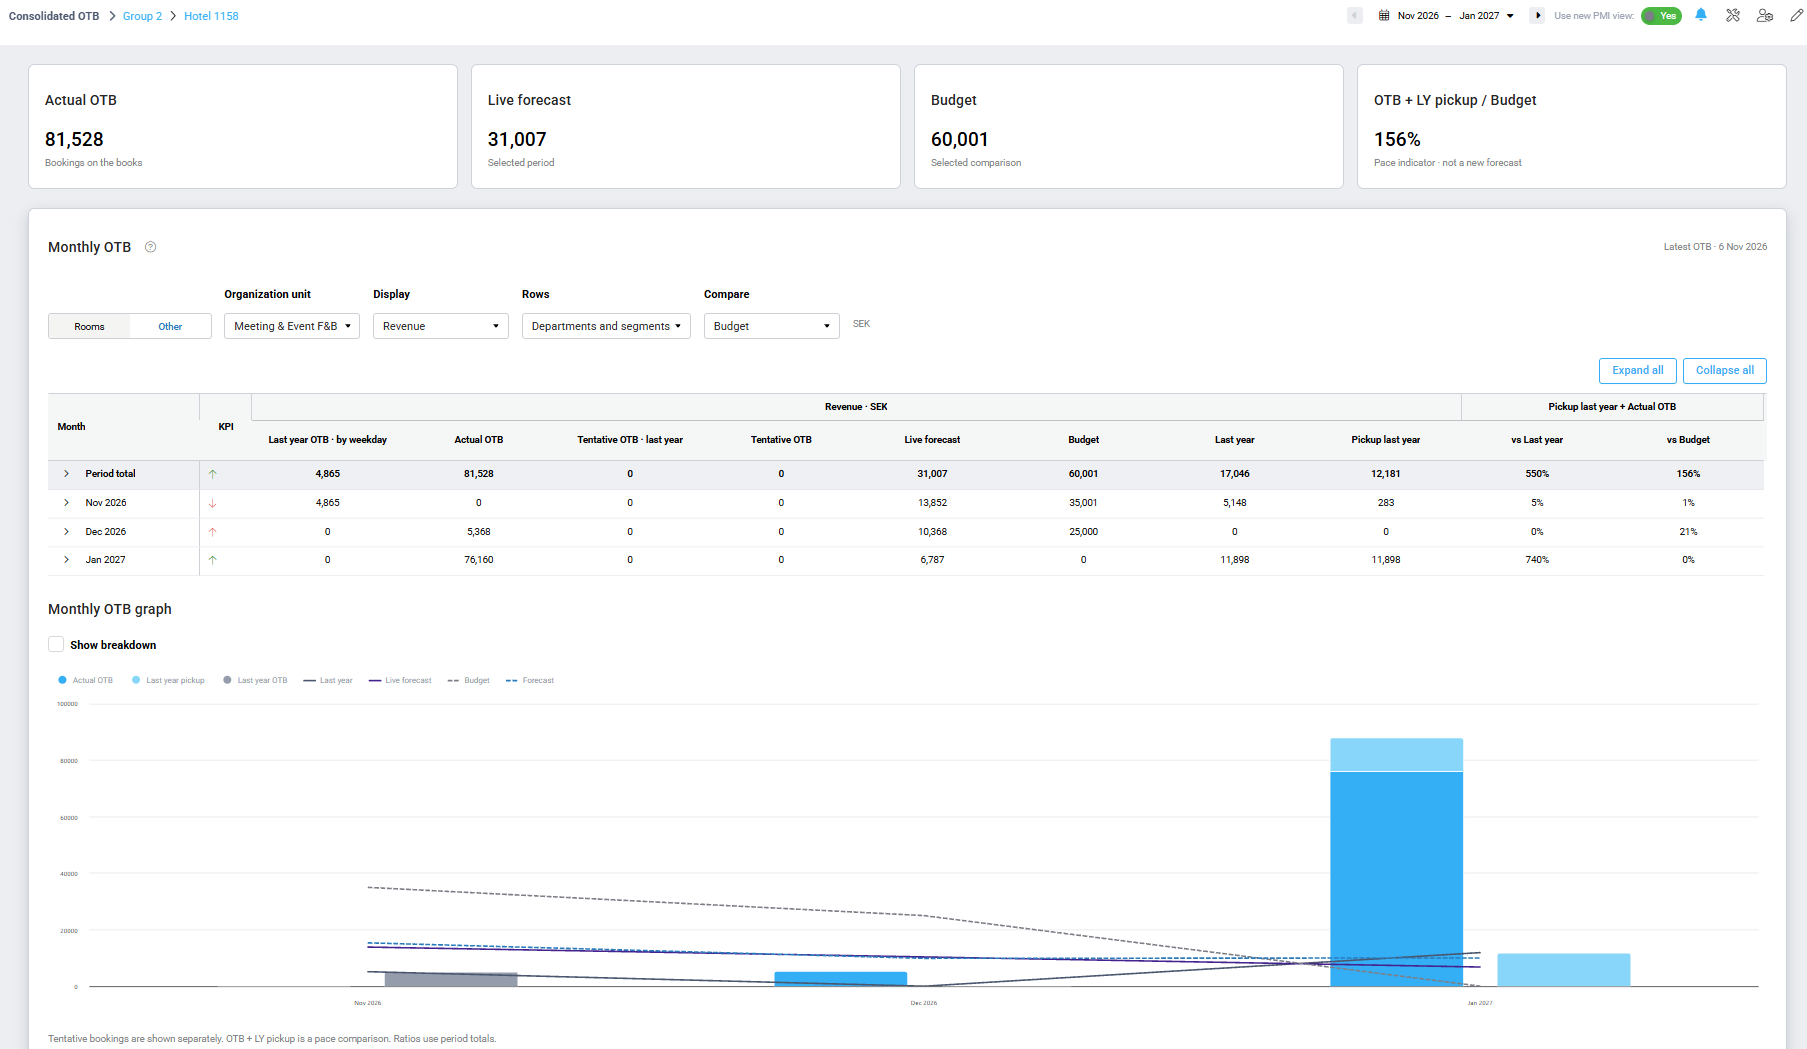
(Angular/updated view)
Coming soon!
What is its purpose?
The Consolidation OTB module in PMI gives you an overview of the total On The Books (OTB) for the current and future months, compared with last year and your selected forecast or budget.
It helps hotel managers and department heads monitor booking performance, compare current bookings with the previous year, and identify how bookings are developing across different properties and departments.
Information is presented in a monthly table, with a graph below it to help you compare trends over a longer period.
The module provides several ways to view and compare the information:
- Table: View monthly figures and compare OTB values.
- Graph – Dates: Compare values across dates in the selected period.
- Graph – Accumulated: View how OTB develops over time as an accumulated value.
The information is available for Rooms and other departments that use OTB in the Live forecast.
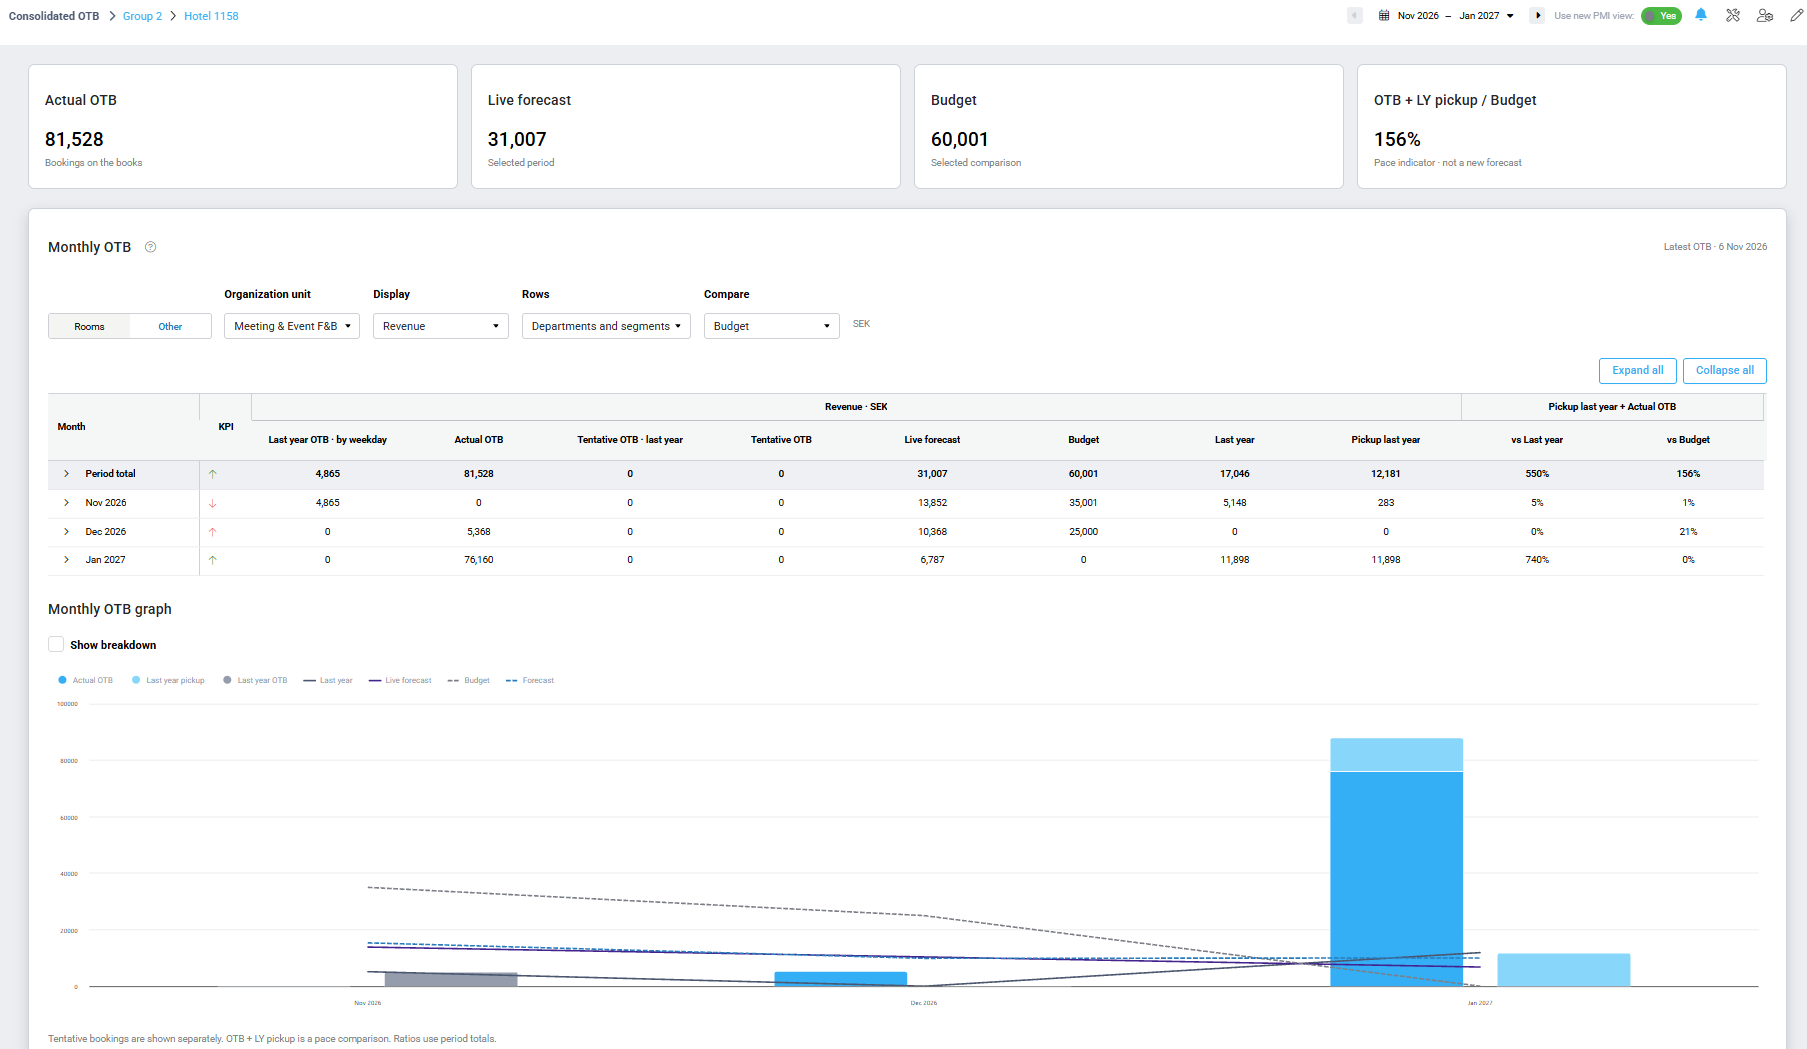
Full view of the updated Consolidation OTB screen, showing the summary tiles, monthly table and graph.
How is it used?
Consolidation OTB is designed to give you a consolidated overview of booking performance.
You can select an individual property, a group, or all chain properties, depending on your access and PMI setup.
The module allows you to:
- Compare current OTB with Last Year OTB.
- See how bookings have developed compared with last year through Pickup Last Year.
- The report covers both Rooms and Other (non-room revenue), with different measures available depending on the selected view and the hotel’s configuration.
- Expand monthly figures to see additional details by property, department or segment.
Navigation
Open the main menu and select Consolidation OTB.
Once the module is open:
- Use the property selector in the page header to choose an individual property, a group or all properties in the chain, depending on your access rights.
- Note: Consolidation OTB displays the current and future months only. Historical months cannot be selected. You can select a maximum period of 24 months. If you select a period longer than 24 months, PMI will not display the full selected period.
Selecting a period
Use the date selector to choose the period you want to review. You can change the dates by clicking on the date fields or using the arrows.
The selected period determines the dates and monthly figures displayed in the table and graphs.
The report updates automatically when the selected period changes.
Updated view: You can switch between using the old and new views by using the toggle: Use new PMI view option in the page header. PMI remembers your personal selection.
Understanding the overview tiles
At the top of the page, summary tiles provide a quick overview of the selected period. These include:
- Actual OTB: The value currently on the books.
- Live forecast: The expected result, combining actual results for elapsed days with the forecast for the remaining days.
- Comparison: The selected Forecast, Budget or Last year value.
- OTB + LY pickup: Current OTB combined with the pickup achieved by the same point last year.
The pace indicator compares OTB + LY pickup with the selected comparison. It gives you a quick indication of whether the current booking pace is above, below or in line with the comparison.
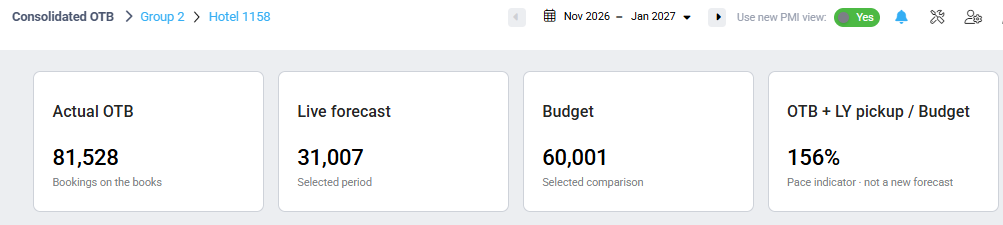
Close-up of the four summary tiles, showing their labels and values.
Selecting the information to display
Use the options above the monthly table to adjust the information displayed.
Rooms and Other
Switch between Rooms and Other to view the relevant OTB information.
Rooms includes the following measures:
- Room nights
- ARR
- Room revenue
- Occupancy
Other displays OTB for non-room departments, such as Restaurant, Meeting & Events and Spa. The departments available depend on your PMI setup and which departments use OTB in the Live forecast.
Select the relevant organization unit from the dropdown when viewing Other.
The available measures depend on the department setup:
- Revenue
- Covers
- Average cover revenue
Covers and Average cover revenue are only available for departments where covers are activated and included in the forecast. Revenue is available for all departments with OTB.
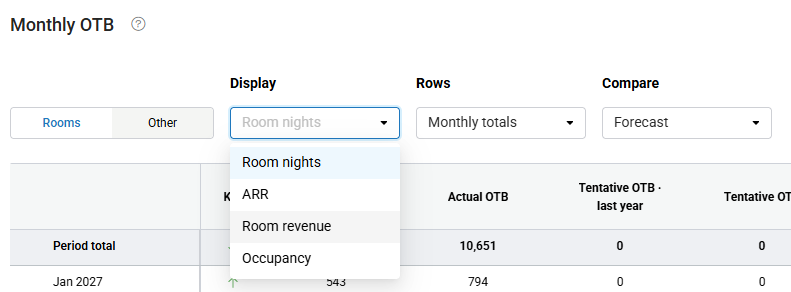
Monthly OTB can be viewed by Rooms or Other
Rows
Use the Rows dropdown to choose how the information is grouped in the table.
Depending on your selection and PMI setup, you can display:
- Monthly totals: A monthly overview of the selected values.
- By property: A breakdown by property when viewing a group or chain.
- By segment: A breakdown by segment.
- By segment group: A breakdown by segment group.
- By department: A breakdown by department when viewing Other for a single property.
- Departments and segments: A more detailed breakdown when viewing Other for a single property with segments configured.
When a breakdown is selected, you can expand or collapse the rows to see more detail. Use Expand all or Collapse all to open or close the available levels.
The period total is displayed separately from the monthly rows.
Compare
Use the Compare dropdown to select the value you want to compare against:
- Forecast
- Budget (the budget name may differ depending on your organization)
- Last year
Your selection updates the comparison shown in the summary tile and monthly table.
When Last year is selected, the separate Forecast comparison column is removed, as it would show the same last-year information.
Personal view options
Use Personal view options to adjust how information is displayed in the table and graph.
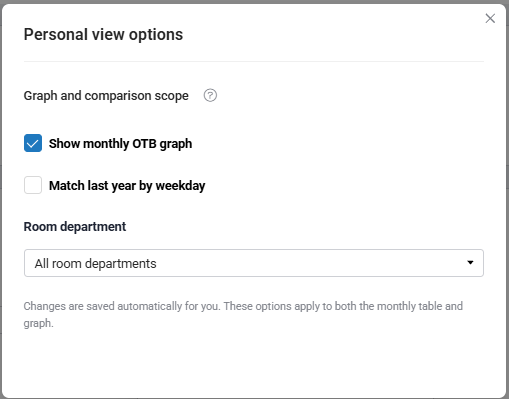
Personal view options when Rooms are selected
Available options depend on the selected view and your PMI setup.
- Show monthly OTB graph: Show or hide the graph below the table.
- Match last year by weekday: Choose whether last year is matched by weekday or calendar date.
- Room department: Select the room department when viewing Rooms.
Your personal view settings are saved automatically.
Segment level and Segments
When viewing information By segment, you can select the segment level (Primary, Secondary or Subsegment) and filter the report to specific segments.
These options are only available for properties using standard segments.
Your personal view settings are saved automatically and apply to both the monthly table and graph.
Monthly OTB table
The monthly OTB table provides a monthly overview of the selected period, with one row for each month.
The Period total row shows the combined figures for the entire selected period and remains visible when scrolling through the table.
Depending on the selected comparison and available data, the table can include:
- Last year OTB: Bookings on the books at the corresponding point last year.
- Actual OTB: Current confirmed bookings.
- Tentative OTB: Bookings currently held as tentative, where this functionality is activated.
- Live forecast: The latest rolling forecast.
- Forecast or Budget: The selected comparison.
- Last year: Last year’s final result.
- Pickup last year: The additional bookings received after the equivalent booking date last year.
- Variance against last year: How the current outlook compares with last year
- Variance against the selected comparison: How the current outlook compares with the selected comparison
The available columns depend on the selected comparison and measure.

The period total row remains visible when scrolling through the monthly information.
You can also use the KPI indicator to quickly see how the current outlook compares with the selected comparison. Hover over the indicator to see more information about the comparison and the figures behind it.
Note: When viewing information by segment, the total may represent only the selected segments rather than the full property total. PMI marks affected rows and provides an explanation in the tooltip.
KPI indicators
The KPI indicator provides a quick overview of the booking position for each month and the period total.
The indicator uses both colour and direction:
- Green or red indicates whether the current outlook is at or above, or below, the selected comparison.
- An upward or downward arrow indicates whether the outlook is at or above, or below, last year’s result.
Hover over the indicator to see a more detailed explanation of the comparison.
Last Year OTB
Shows what was On The Books on the corresponding date last year, for the equivalent future period.
You can choose how to match last year’s OTB values with the current year:
- By Date: Compares with the same calendar date last year.
- By Weekday: Compares with the same weekday last year.
Example: If today is 10 November 2026, Last Year OTB shows what was On The Books on 10 November 2025 for the period November 2025 to November 2026. This is compared with the current OTB for November 2026 to November 2027.
Actual OTB
The Latest OTB date, displayed next to the Monthly OTB heading, indicates how current the booking information is. This date is based on the hotel’s date and may differ from your computer’s date.
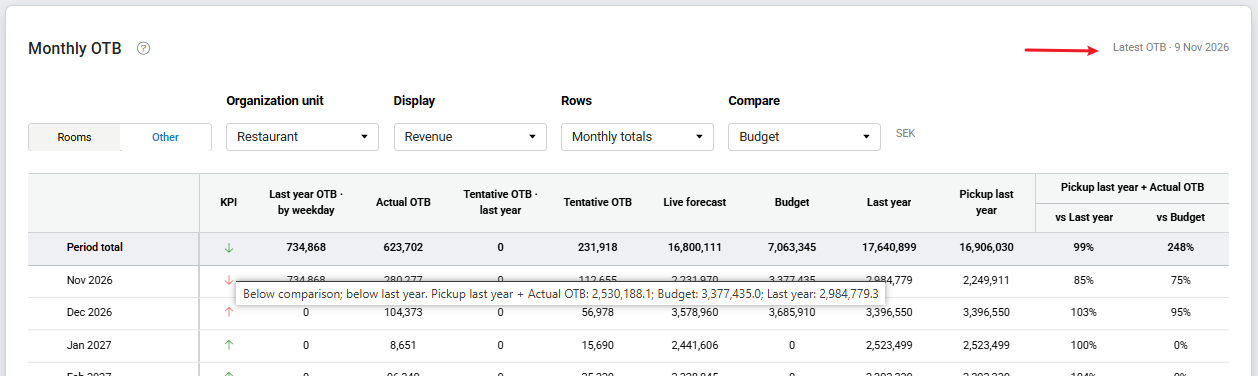
Monthly OTB table showing the column headings, Period total row and KPI indicators with tooltip
Viewing the graph
The graph below the table provides a visual comparison of current OTB, last year’s OTB and the selected forecast or budget.
It includes:
- Current year’s OTB, with last year’s pickup shown as a stacked part of the columns.
- Last year’s OTB at the corresponding booking window.
- Last year’s final result.
- Live forecast.
- Forecast or budget, depending on the selected comparison.
Use the Show breakdown option to split the graph by available categories, such as property, segment or department.
The graph follows the selections made in the table, including the selected measure and other view options.
The graph can be hidden using Personal view options.
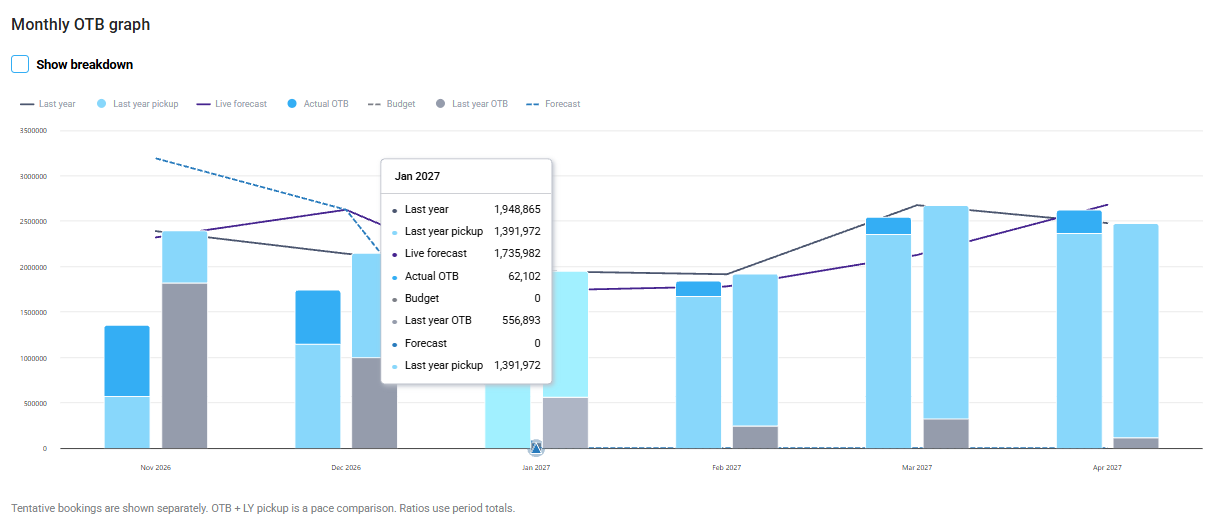
Monthly OTB graph showing all the options
Exporting and extracting data
The Tools menu provides options to export the report or extract more detailed data for further analysis.
Export to file
Use the Print to file option to export the selected report.
Available formats include:
- Excel: Downloads a workbook with separate sheets for the available measures, including monthly figures, breakdowns and period totals.
- Google Sheets: Exports the workbook to your Google Drive. This option is only available in supported sessions.
- PDF: Downloads a printable version of the report, with one page per measure.
The export includes all available measures for the selected scope, not only the measure currently displayed on the screen.
Extract data
The Extract data option allows you to create a more detailed Excel workbook for selected properties.
- Open the Tools menu and select Open under Extract data.
- Select the desired period.
- Select the properties to include. You can choose a single property, a property group or all properties in the chain, depending on your access rights.
- If required, add or remove individual properties from the Available properties and Selected properties lists.
- Click Extract data to download the workbook.
The extracted workbook contains monthly figures for each selected property, together with the period total and the relevant comparison values.
A maximum of 300 properties can be included in one extract.