
Some enhancements and updates have been made to the PMI adoption index. These enhancements simplify the page view, making it easier to understand the overall and individual scores and the actions that need to be taken for each department, property, group and chain.
New features
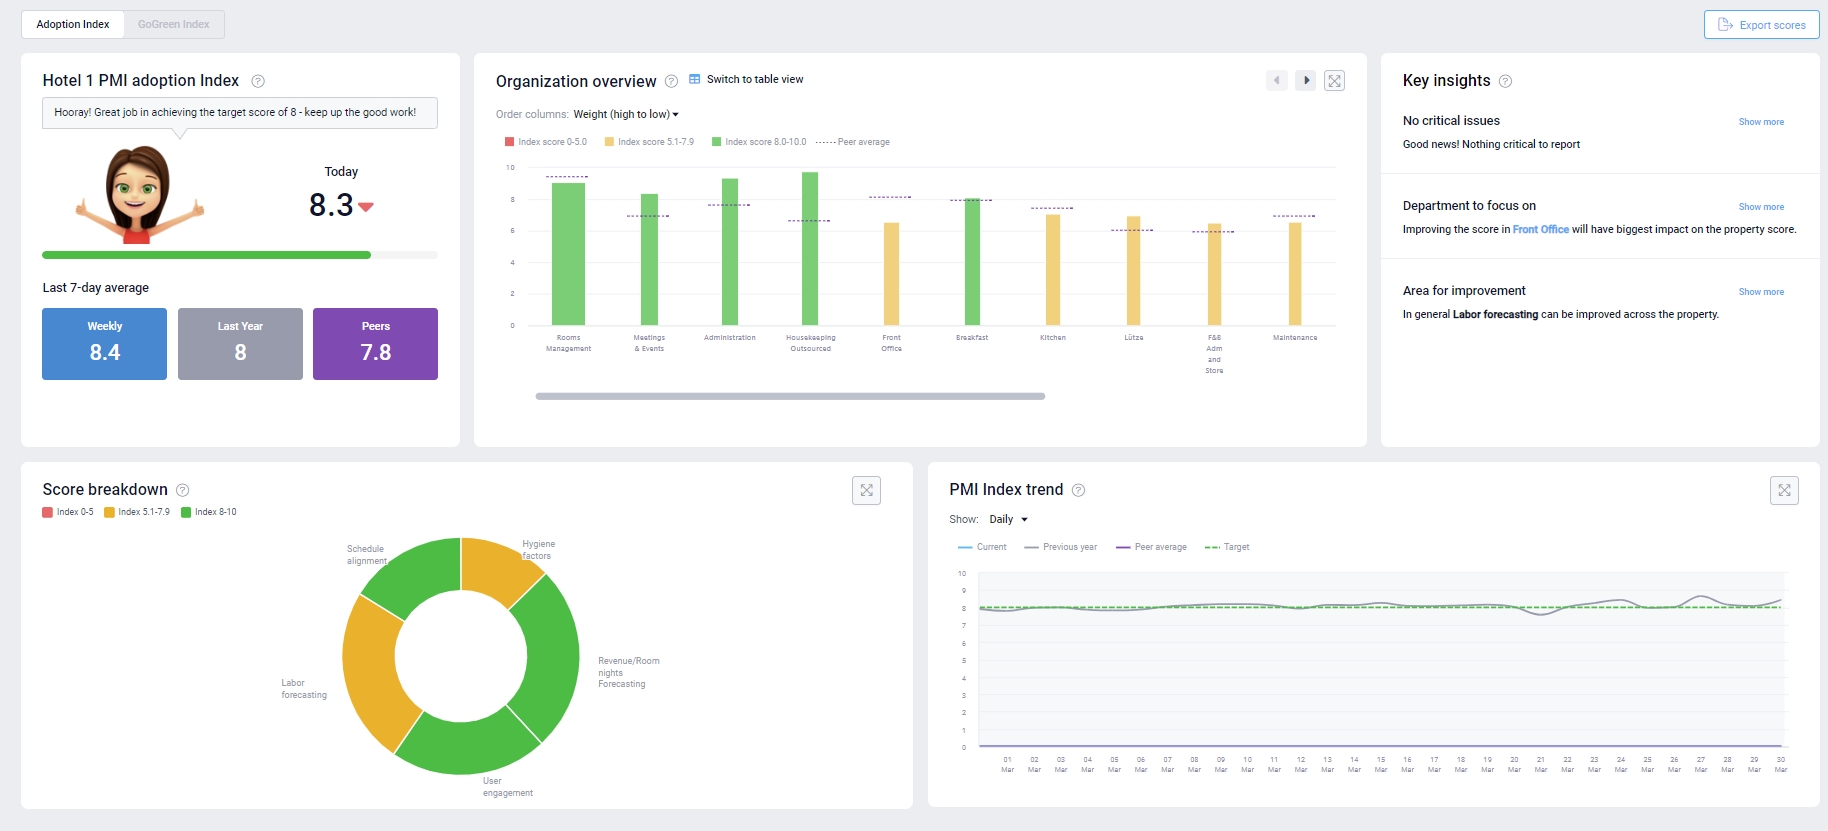
Image description: The updated view in the PMI adoption index page.
- Export score – Export historical index scores for a department, property, group or chain via the button in the top left corner. This is only available on property, group or chain view.
-
- Option to select daily, weekly or monthly scores.
- You can select a maximum of 12 months of historical scores.
-
- Score breakdown chart – The new breakdown chart groups the measurements into 5 disciplines. Its purpose is to highlight which area has the most improvement potential. Click on a section for a deep dive into what is being measured in that area.
- Group view – A group view is now available. This is useful to track the performance of all properties within a group.
- Key insights – At property, group and chain level, the highest/lowest performing properties are highlighted, as well as areas that need additional focus.
Updates to existing features
1. ARM tiles
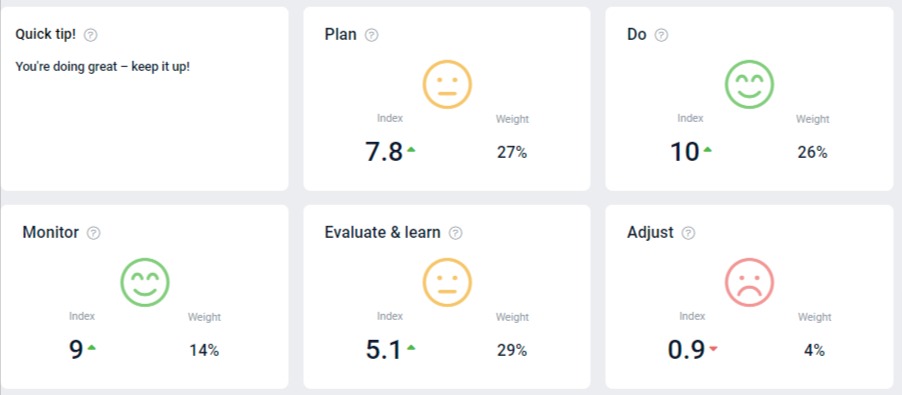
Image description: The ARM tiles in PMI adoption index.
-
-
- At department level, the ‘Plan’, ‘Do’, ‘Monitor’ ‘Learn’ and ‘Adjust’ tiles now shows the index score for each section out of 10. It also shows the weight percentage of that section. This replaces the points that were previously shown. Focusing on the areas with a higher weighting will have the biggest impact on your total index score.
- The text for the recommended actions that are shown when a tile is clicked has also been updated and simplified.
-
2. Organization overview graph and table
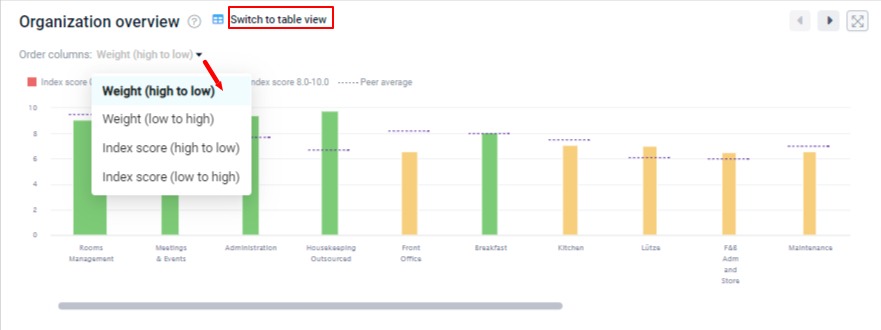
Image description: The organization overview graph in PMI adoption index.
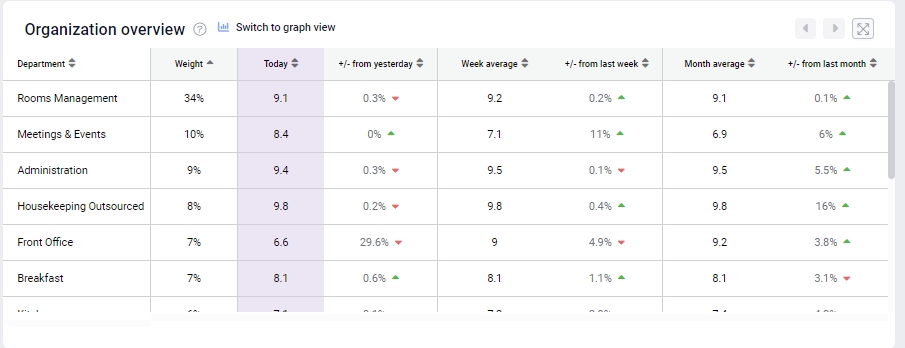
Image description: The organization overview table in PMI adoption index.
-
-
- There is now an option to order the bars by weight or by score.
- ‘Switch to table graph’ then lists all the details in table format. You can sort the list by clicking the arrows in the table header.
-
3. Index trend graph
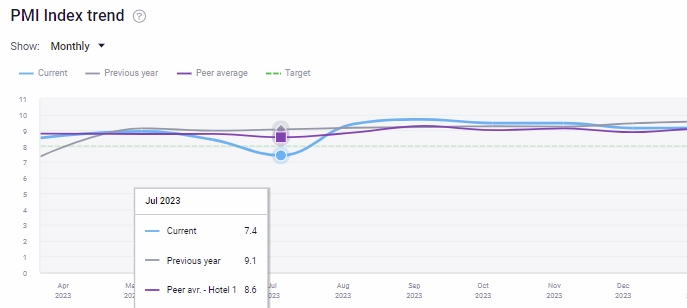
Image description: The index trend graph in PMI adoption index.
-
-
- The trend graph will show the department’s score over time. Previously it showed the property score only.
-
4. Menu navigation

Image description: Menu navigation in PMI adoption index.
-
-
- The menu is now in the main header. To view a group level, select a group, then click ‘All properties’.
-
5. GoGreen index
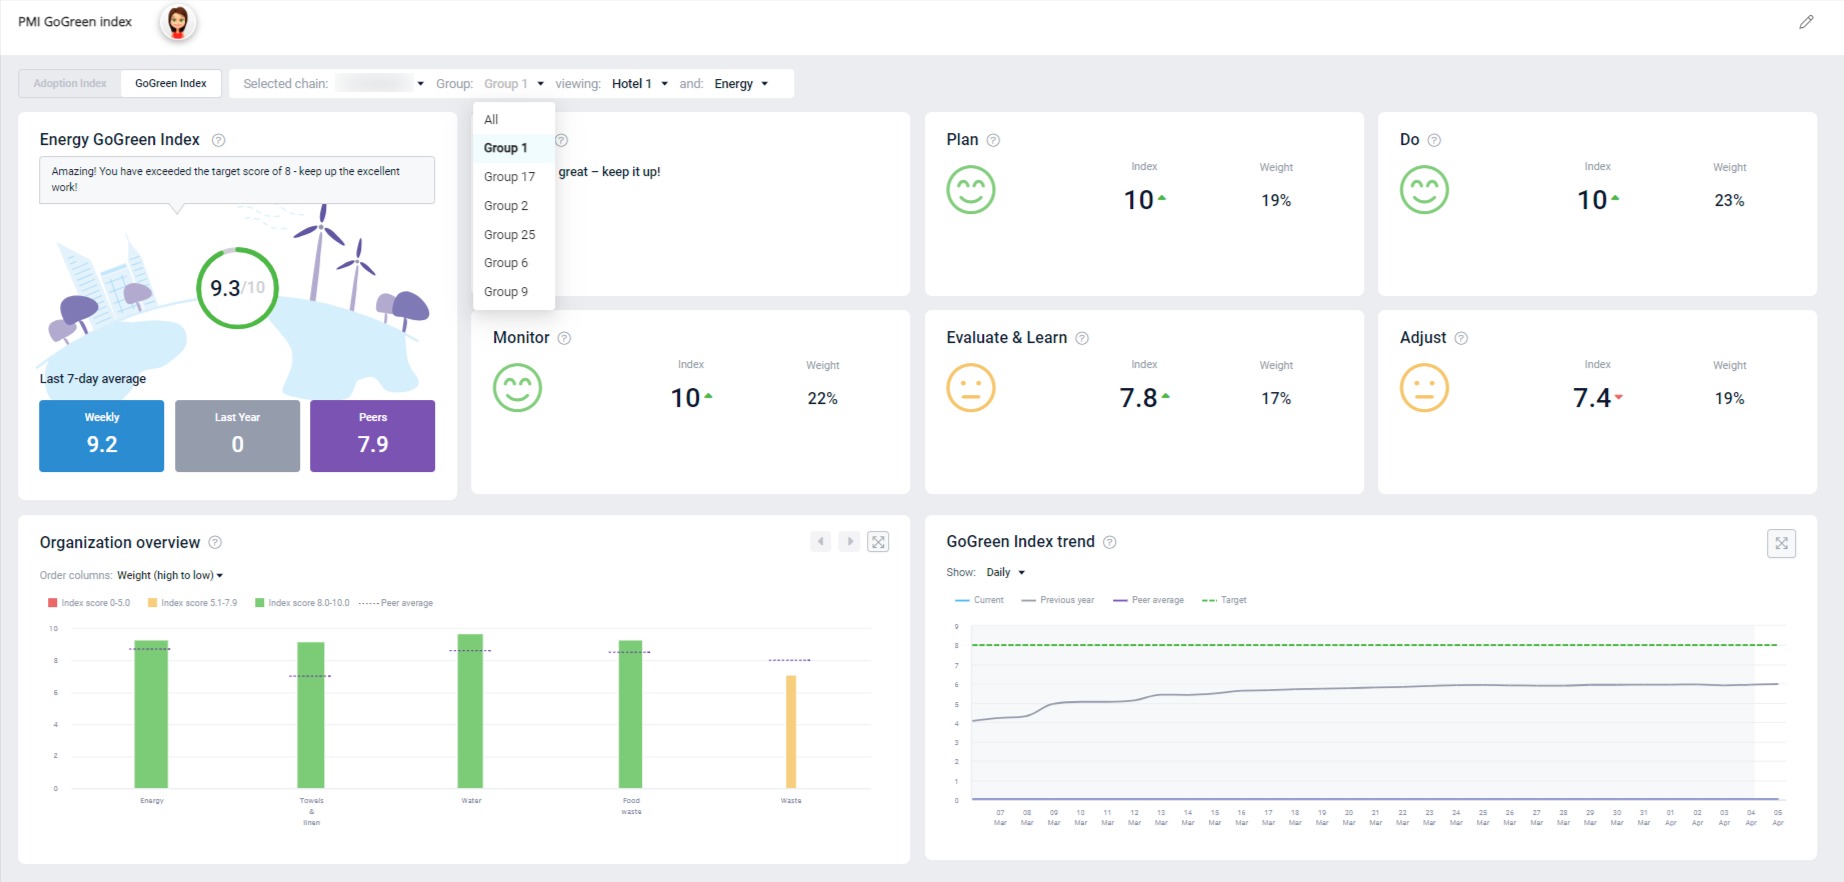
Image description: The updated view in the PMI GoGreen adoption index page.
-
-
- ‘Plan’, ‘Do’, ‘Monitor’ ‘Learn’ and ‘Adjust’ tiles now have score out of 10 and weight instead of points.
- Group view is available in GoGreen index.
- Export options are also available in chain, group and property view in GoGreen index.
-
Full details are available in the overview article.