Symptom: PMI Adoption Index slips below the target (8.0) or the Index trend graph shows a downward slide.
1. Pin-point the heaviest drag
- Open Organization overview.
- The thicker the green / orange bar, the more weight that department (or routine) carries in the total score.
- Start with the bar named in Department to focus on – lifting that one moves the needle fastest.
Tip: Skip hygiene tiles for now. “Hygiene factors” show operational health, but in the Adoption Index their weight is 0 %. Fix them after the high-weight bars are green.
2. Open Score breakdown
Red and amber slices expose which routines are off-track.
Typical trouble spots and one-minute checks:
- Scheduling discipline: Cockpit banner red or amber? Open the Cockpit and click Save.
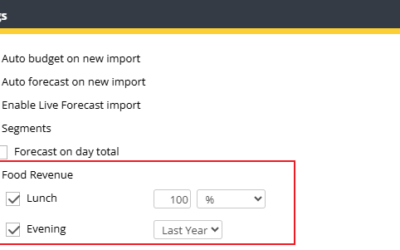
- Labour forecasting: Next month still Pending? Submit or lock the forecast.
- Productivity accuracy: Live Forecast > 10 % away from Forecast? Review cost-driver or hours and resave.
- Hygiene factors: (red triangle or amber “?”) Enter missing hours, clear warnings.
3. Run the daily hygiene for that department
Make sure, for yesterday:
- Live Forecast saved (no red triangle).
- Cockpit saved (banner turns green).
- Schedules sent to Forecast.
- Current month status = Live; next month = Ready / Locked.
Do this today – the Adoption tile recalculates overnight.
4. Coach for consistency
- Ask the HOD to repeat the same four-point check every morning.
- Show the payoff: higher RevPOLU, fewer last-minute edits, smoother staffing.
5. Re-check tomorrow
- The headline score should tick up after one night.
- If it doesn’t, tackle the next-largest red / amber slice and repeat.
Ignore technical tiles such as Integration Status unless data is actually missing – they don’t influence the Adoption Index score itself.