
Objective
The CoE Analytics Revenue and Productivity provides interactive Power BI reporting for customers with the relevant subscription and access. It supports analysis of revenue, labour productivity and cross-property performance.
The report pages and available measures can depend on the deployed report package and configuration. Start with the pages provided to your organization rather than assuming that another customer’s report has the same layout.
Open the report
Use the PMI main-menu entry CoE analytics suite – R&P where it is enabled. The documented navigation places the analytics entry under Administration, even though its function is analysis rather than changing PMI configuration.
If the entry or report is unavailable, ask the administrator to check the subscription, role and property/chain access.
Establish the reporting context
Before reading a result, identify the report page, selected properties/outlets, period and comparison. Review any active filters or selected chart items. An earlier selection can leave the report focused on a subset of data.
Check the report’s data-freshness information where provided. A recent operational change in PMI may not yet be reflected in the analytics view.
Run a focused review
- Choose the report page that addresses the business question.
- Set the intended period and organizational scope.
- Confirm the meaning and units of the selected measure.
- Review the total, then use the available interactions to explore the contributing detail.
- Check any comparison on the same basis and note the active selections.
- Agree which operational view or responsible colleague should investigate the finding.
Interactive selections can change other visuals on the page. Clear or reset them through the report’s supported controls when moving to a new question.
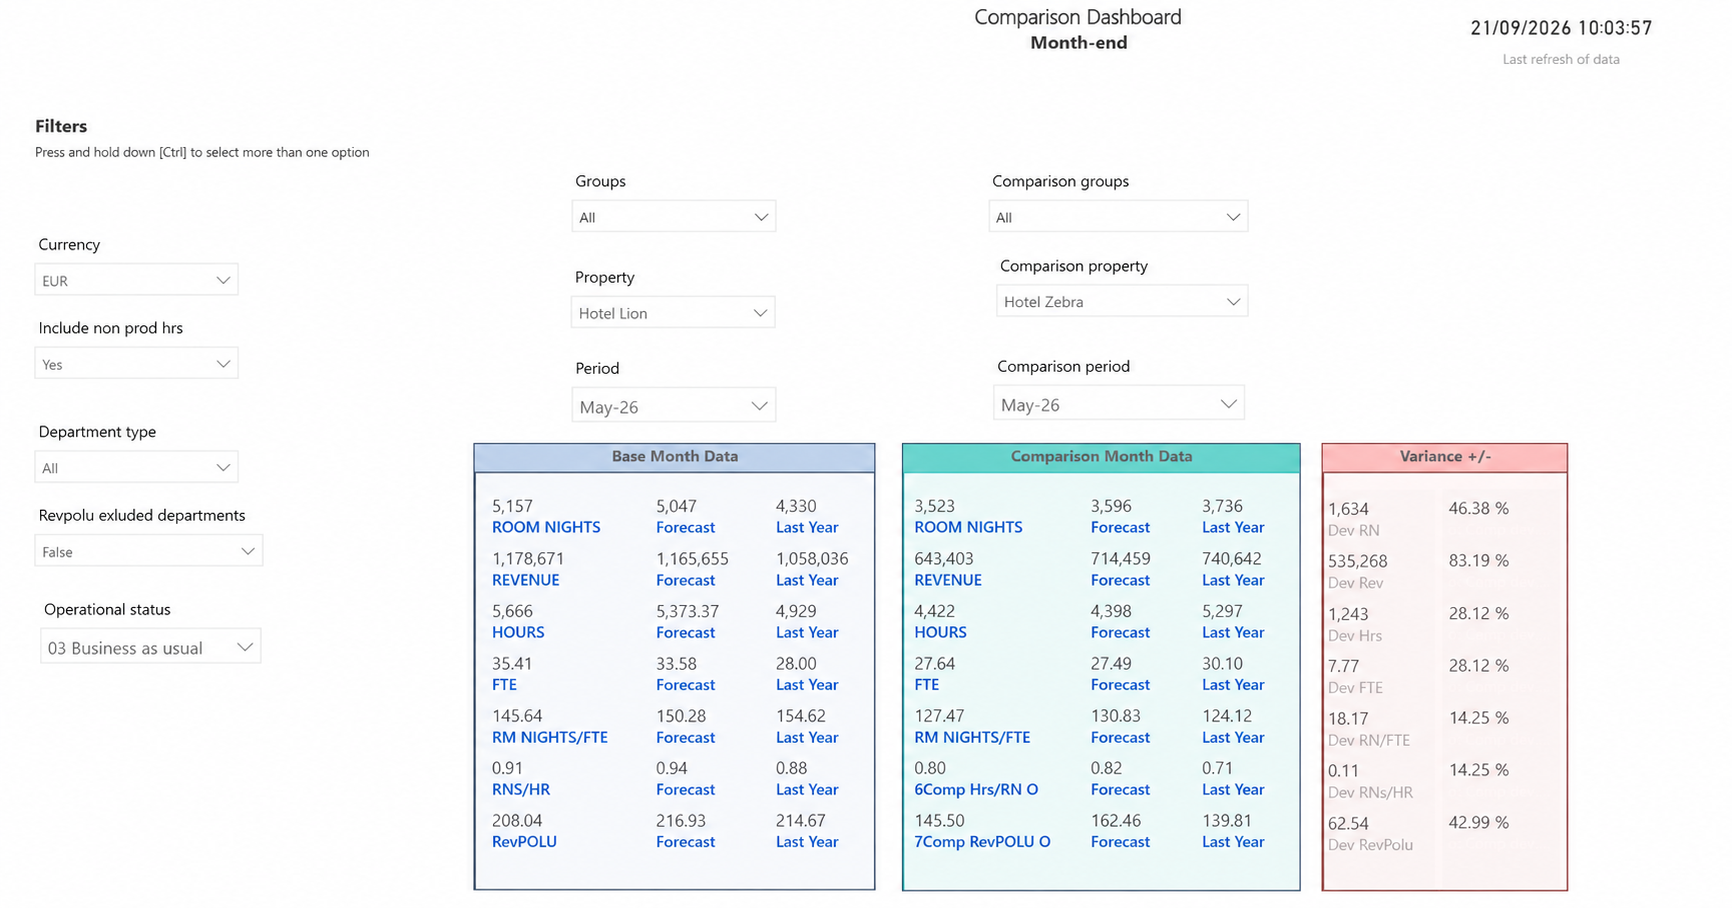
Example
Demo Group compares the productivity picture for two fictional properties. Before interpreting a difference, the analyst checks the reporting period, metric definition, department scope and the available source context.
Explain the result
A useful handover states the business question, report page, filters, period, observation and next action. Keep a reported association separate from a confirmed cause. If two reports disagree, first compare their definitions, scope, dates and refresh state.
Where export is permitted, check what the selected export contains and share it only with the intended audience.