Objective
Consolidation OTB provides a monthly overview of booked business for a property or group. Use the table and chart to review the booking position over a longer period and compare it with last year and the selected Budget or Forecast.
It is useful when a manager needs to move between the portfolio picture and the departments or segments that explain it.
Choose the context
Open Consolidation OTB from the main menu. Select the property or group you want to review and choose the date range. Confirm that the selection matches the scope of any report you plan to compare with it.
OTB means the booked position. The Budget or Forecast comparison is the last submitted value for the selected period. These are different reference points; a gap between them needs interpretation rather than an assumption that the report is wrong.
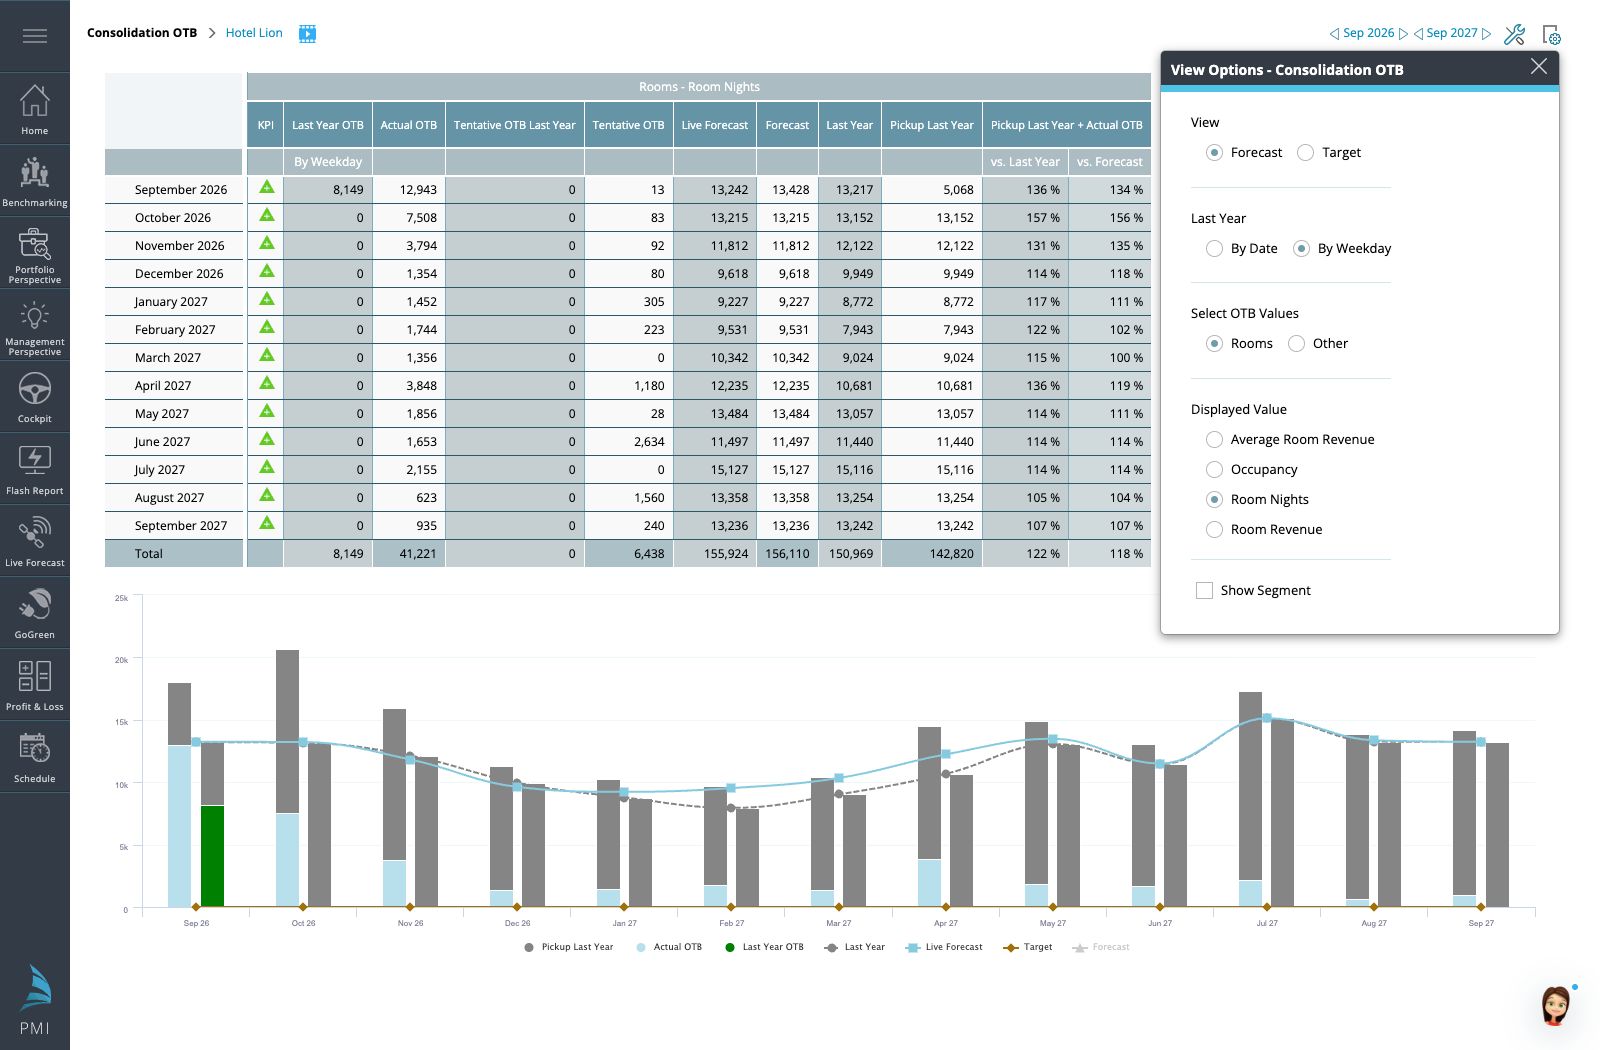
Use Personal view settings
- View: select Budget or Forecast as the comparison.
- Last Year: choose the same calendar date or the corresponding weekday.
- OTB Values: choose the measure to display in both the table and the chart.
- Rooms: available measures include ARR, occupancy percentage, room nights and room revenue.
- Other departments: available values depend on department setup and whether the department uses OTB in Live Forecast.
- Department and segment detail: show the relevant detail, then expand a month using its plus sign.
For non-room departments, Covers and Average cover revenue appear only where those values are available. Selecting Revenue can show the departments with OTB even when cover-based measures are unavailable.
Review from summary to detail
- Start with the monthly totals for the selected property or group.
- Check the chosen measure and comparison basis.
- Find a month with an unexpected difference.
- Expand that month to inspect the available property, department or segment detail.
- Check whether the pattern is widespread or concentrated in one part of the business.
- Use the relevant departmental forecast view for a closer review of expectations.
Example
Demo Group contains Demo Hotel A and Demo Hotel B. The group’s room revenue OTB is behind last year for one month. Expanding the month shows that most of the difference comes from one property. The manager checks that property’s booking position and event assumptions before proposing a group-wide response.
When comparisons do not match
Check the property/group, period, measure, last-year date basis and submission status of the comparison. For missing non-room data, verify that the department has OTB configured and supports the selected measure. Use Import Status to investigate delayed source data.
Share the report
The Tools menu provides export/print options for the selected data. Record the selections with the export, especially whether the comparison uses Budget or Forecast and calendar dates or weekdays.
Related information
View examples
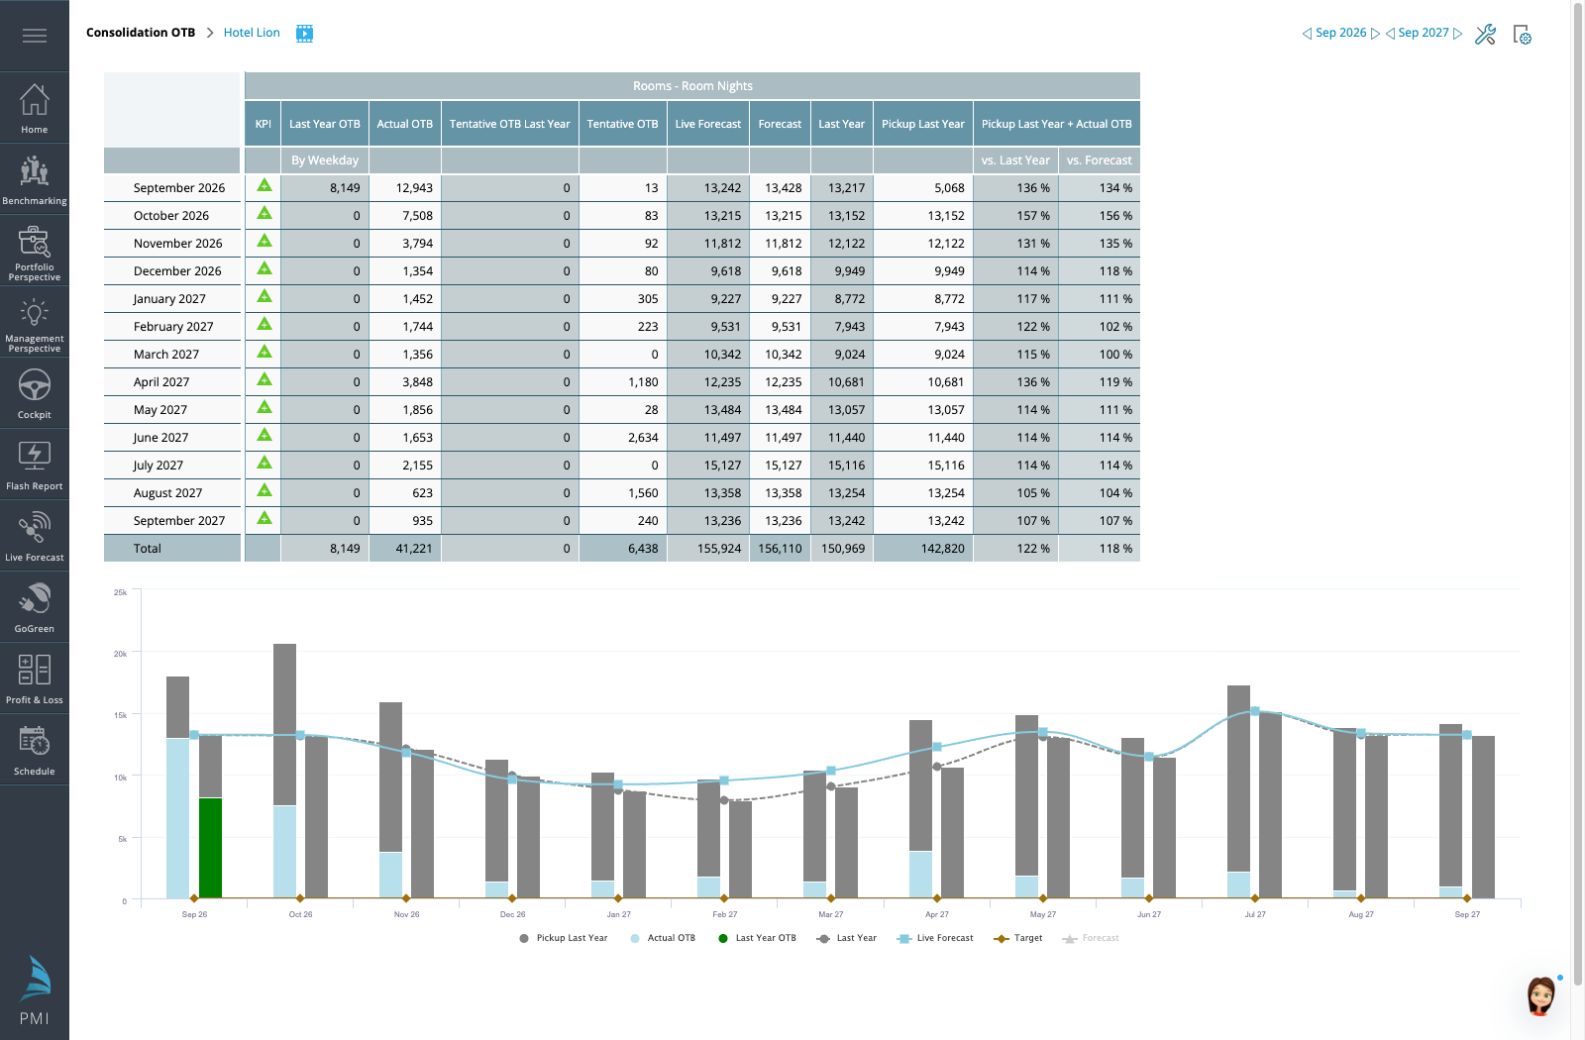
Figure 1. Consolidation OTB with monthly values and forecast comparisons.