
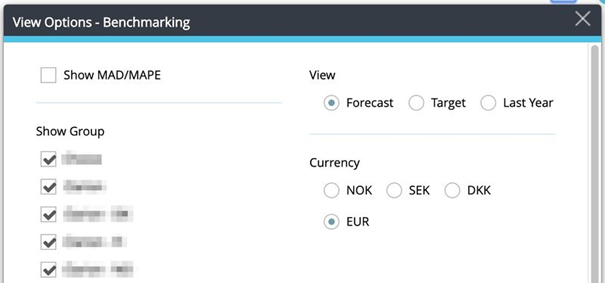
In View options of the Benchmarking module, you can choose what you want to display. Here you can exclude/include different groups. Which properties you see is dependent on your region, user rights and preference
Explore
Expand a question to read its answer, right here.
In View options of the Benchmarking module, you can choose what you want to display. Here you can exclude/include different groups. Which properties you see is dependent on your region, user rights and preference
In the Benchmarking module, you can click the Tools icon toexport the report to Excel or PDF.
MAPE and MAD are forecast accuracy metrics calculated from daily forecast and actual values and averaged over the selected period. This article explains how they are calculated and how to interpret them.
MAD and MAPE are forecast accuracy metrics. They show how close the forecast was to the actual results over a selected period and help you evaluate forecast quality.
In short:
Both MAD and MAPE are calculated using the same approach:
Important: The calculation is based on daily values and then averaged. It is not calculated on the total for the period, as totals can hide daily forecast inaccuracies.
MAPE is useful when you want to understand the error in percentage terms and compare forecast accuracy across different KPIs or properties.
MAD is useful when you want to understand the error in actual KPI values (for example RevPAR or currency), not percentages.
If you want to validate the values outside the system, you can calculate MAD and MAPE in Excel using daily data.
=ABS(Actual – Forecast)
=AVERAGE(range)
=ABS((Actual – Forecast) / Actual)
=AVERAGE(range)
This calculation must be done on daily values, and then averaged over the period.
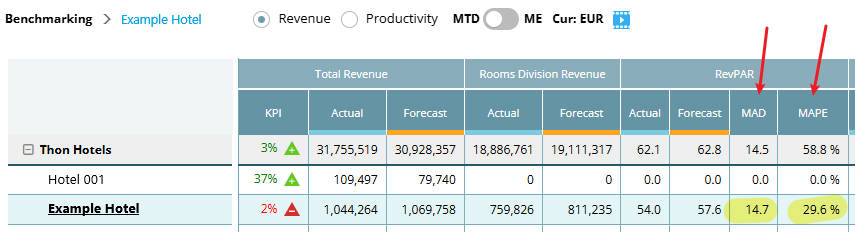
Image: RevPAR MAD & MAPE in Benchmarking
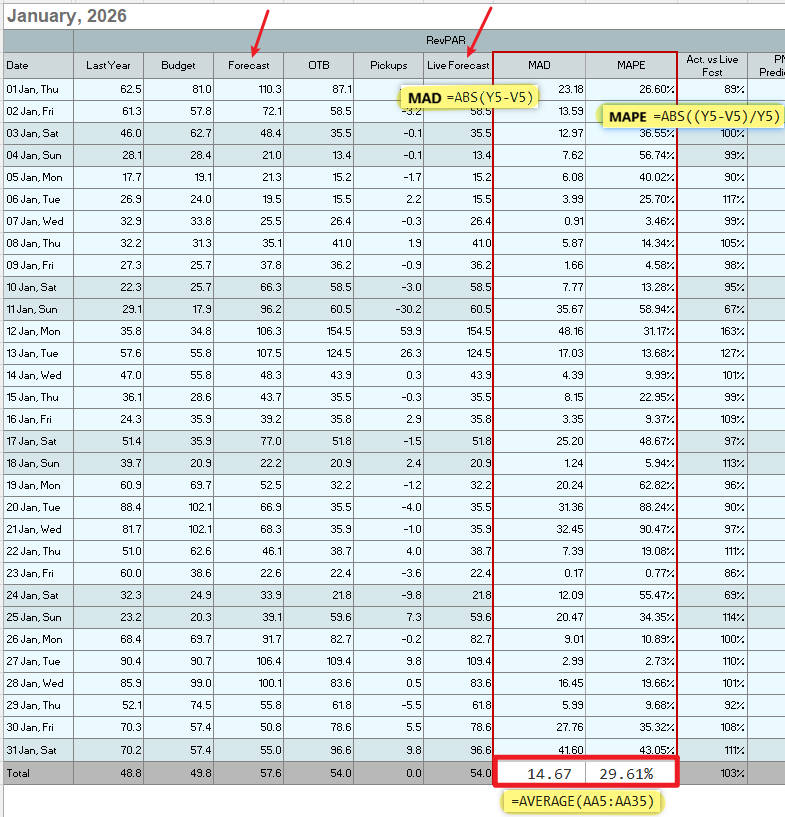
Image: Typical example in Excel with formulas to calculate MAD/MAPE for a month
Benchmarking overview
Portfolio Perspective overview
RevPAR Stands for Room Revenue Per Available Room and TrevPAR stands for Total Revenue Per Available Room.
The KPI indicates how you are pacing MTD vs Forecast, Budget, and LY.
The direction of the arrow shows the trend compared to last year. An arrow pointing upwards means that the KPI is performing better than last year and vice versa.
A green arrow with a plus sign means that the KPI is performing better than the target, e.g. Forecast, Budget or Last year, depending on the choice of target.
A red arrow with a minus sign means that the KPI is performing worse than the target, e.g. Forecast, Budget or Last year, depending on the choice of target.
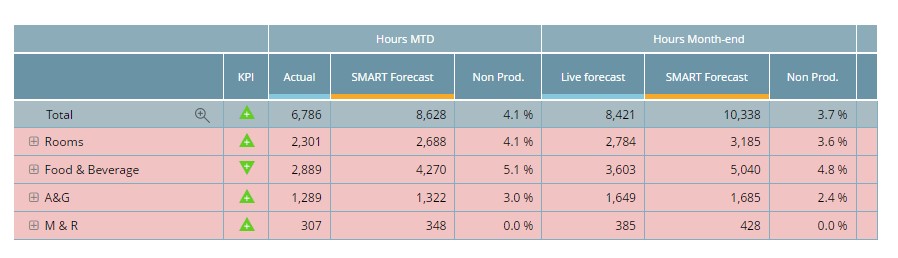
The absence column displays the non-productive hours. Hours that are paid for but non-productive at your department/property.
Benchmarking is a report listing the properties in your group (or the ones you have access to see), allowing you to compare (benchmark) your property’s revenues and productivity.
The budget should be uploaded/entered once a year while the Forecast should be updated every month. Below are some steps on how to update the budget or Forecast:
Optimally, you will already have a 12+ months Live forecast that can be submitted to budget just like the Forecast is submitted every month. Check that the monthly revenue figures per department and month correspond with what you plan for your budget for next year.
Use the PMI Flash Report with year view, to check total revenue.
Under Submit several Live Forecasts (available from tools menu you can choose to submit to Forecast or budget. Remember to set next year as the period, select “all months” and “total” before you submit with the green button. Save.
The cost driver is what drives the labor cost/hours in a department. The cost driver is what gives the department work to do. This could be room nights for the housekeeping department or revenue/covers for a restaurant outlet.
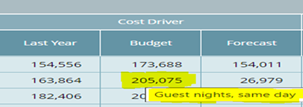
When hovering the mouse over the figures in the Cost Driver column, the current cost driver will be displayed in the tool tip.
A good way to set a productivity goal (target) is to use last year as a reference and see if you can achieve similar or better productivity this year. Budget is also a reference, as we don’t want to be less productive than what we have budgeted. This would negatively affect our bottom line, provided the budget is realistic.
The forecasted cost driver divided by the productivity target gives you the hours you need for the month. PMI best practice highly recommends working with productivity targets to establish the needed hours per department.
Alternatively, you can find the productivity target by entering the hours first. Forecasted cost drivers divided by hours will give you a productivity target.
In PMI you should always forecast/budget your activity/cost-driver/rooms/revenue before you start to work on your staffing and productivity targets. When your cost driver is updated, you put in your productivity target and PMI tells you the number of hours you can spend each month.
Some departments (operational) have productivity as their main target, so when the cost driver changes, this will give the department more or fewer hours, depending on the latest Live forecast.
Some departments have hours as their main target (admins) so even if activity changes, the expected hours will not change. Under settings in the Cockpit, you can see if a department is working by productivity or hours.
Example: You had more rooms to clean, but the same amount of staff to clean them. The staff then needs to clean more rooms in the same amount of time, thus increasing their productivity.
Room revenue planning is where you review and update monthly room revenue forecasts and budgets. It replaces the Budget & Forecast page for Room revenue.
The forecast looks at number of room nights, Average Room Rate (ARR) and resulting room revenue. The page provides you with a pre-populated forecast based on existing data available. You can then review and make edits as needed before submitting your forecast. (We have used forecast in this article, but budget/target works the same way)
For detailed instructions on how to update a forecast or budget, read article How to edit a plan (article coming soon).
Department Heads, Revenue Manager, Controller and General Manager.
Following a clear planning cycle makes sure that all departments can access the latest forecast figures throughout PMI.
PMI best practice for room revenue is to review, edit and submit a Forecast monthly for the year ahead with focus on the next 3 months but this is dependent on corporate policies.
The planning screen is currently accessed from the Budget & Forecast page when you choose the division Rooms and the relevant department that contains your Room revenue (typically Reception or Front Office).

Room revenue forecasts can only be edited and submitted through the new Planning page. Access this from the Budget and Forecast page by using the view toggle.

Switch to Yes to access the new Planning page

Switch to No to view in the old Budget and Forecast page.
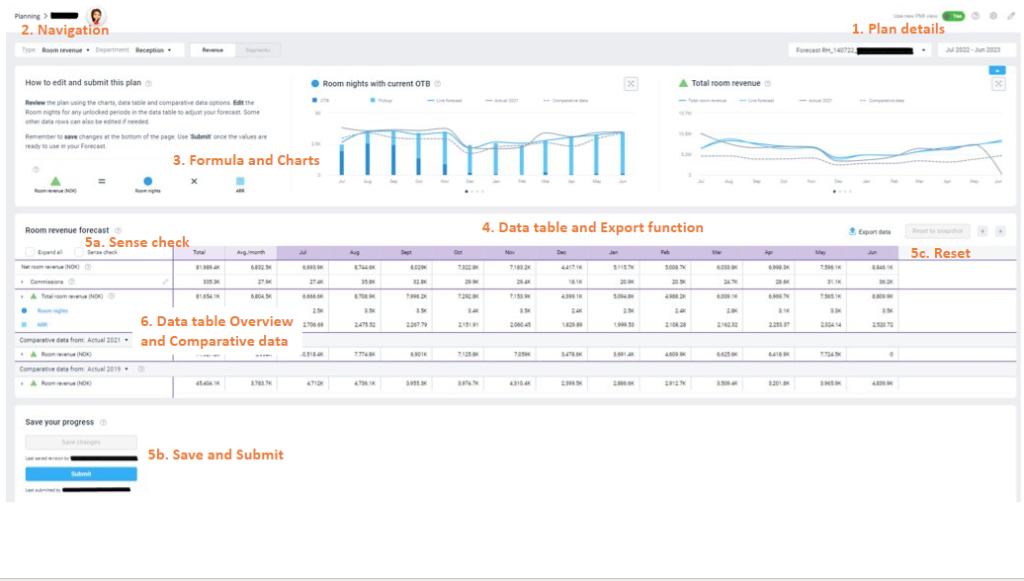
This article gives a summary of the different elements on the Planning page numbered in this picture.
Further details about the specific elements of the data tables are given in the sections Revenue Page: Data table overview and Segment Page: Data table overview.

Remember you can also get similar information in the screen at any point by selecting the help icon for the element you are interested in.
The top right of the page shows the forecast name and period it covers.

Here you can see the department and type of revenue that this Planning page covers.

The main page, Revenue, shows the total forecast and is always available.
A second page, Segment will also be available if that option was selected by the admin user in setup.
More details about choices for Segments in a plan are found in How to set up a plan.
The formula box shows the calculation used to create the forecast values in this page.

The chart area gives a visual representation of the data shown in the table.

Further details about each chart will be available in an article COMING SOON Understanding the Revenue page
The data table on each page shows the forecast values month by month. Where required, figures may display in thousands (K) for easier viewing.
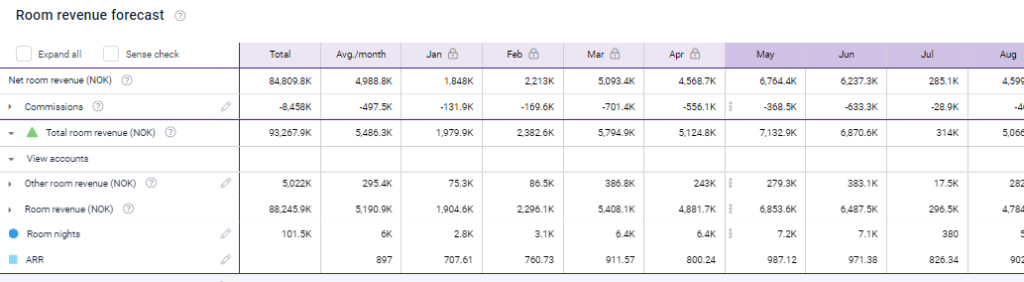
Some data in the tables can be edited to improve the accuracy of the forecast figures before submitting.
For further instructions on this see How to edit a plan
Further information about the Data tables for each page are found in the sections
You can Export the plan at any point by selecting the ‘Export’ data button at the top right of the data table.
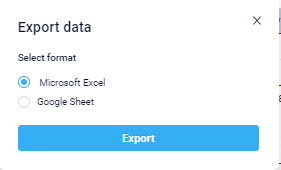
The export will include all data in the table for the page you are in (eg Revenue or Segment), with all rows expanded.
Planning pages have a ‘Sense check’ function that highlights any anomalies in the data that might need reviewing.

Further information about the Sense check can be found in Sense Check Mode Explanation.
The ‘Save changes’ button will ensure your changes are saved for next time you or anyone else comes back to this plan. At this stage, the saved values only exist in this view.
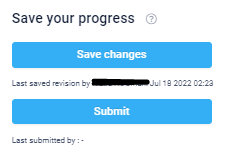
In order to make the plan values available anywhere else they also need to be submitted using the ‘Submit’ button.
The latest submitted version is used in the Forecast (or Budget) throughout PMI.
If changes are made to the data and Saved, there is also the option to undo all changes by using the‘Reset to Snapshot’ button (top right of the data table).

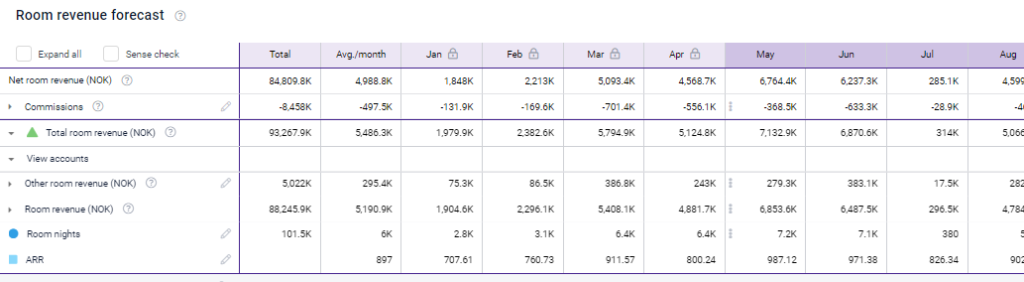
The default view of the Data table on the revenue page is a summary of the main Room revenue figures useful to the Revenue Manager or Department Head.
If you want to examine further details for the Profit & Loss (P&L) financial values, this can be found by clicking ‘Expand all’.
The second section of the data table is the detail under Total room revenue
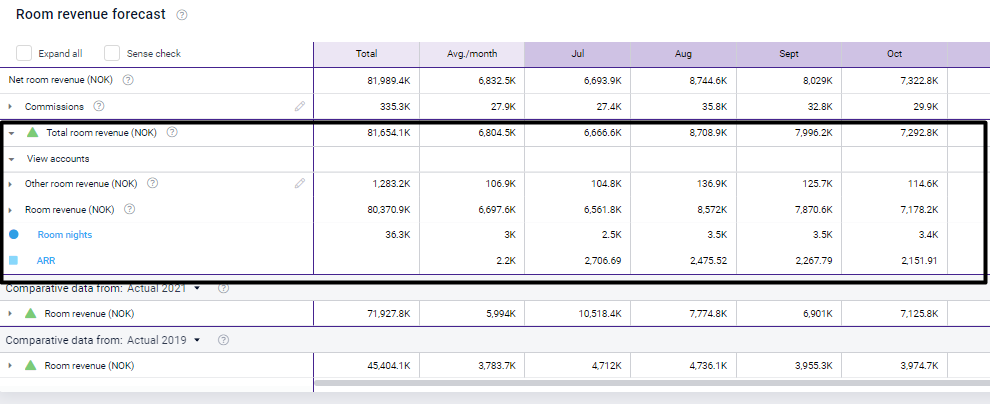
It typically shows the revenue (by account) as well as the Room nights and ARR data.
If this data should be edited in the Segment page, click the blue hyperlinks for Room nights or ARR to jump directly to this.

The extra detail seen by expanding rows shows how the total room revenue will be split between the financial accounts in the Profit & Loss (P&L). These details are not shown in the above screenshot.
Further details about how these links can be set up and how to review the information in them can be found in the article COMING SOON: Room revenue planning: Calculations explained
The third section of the table is the Comparative Data.
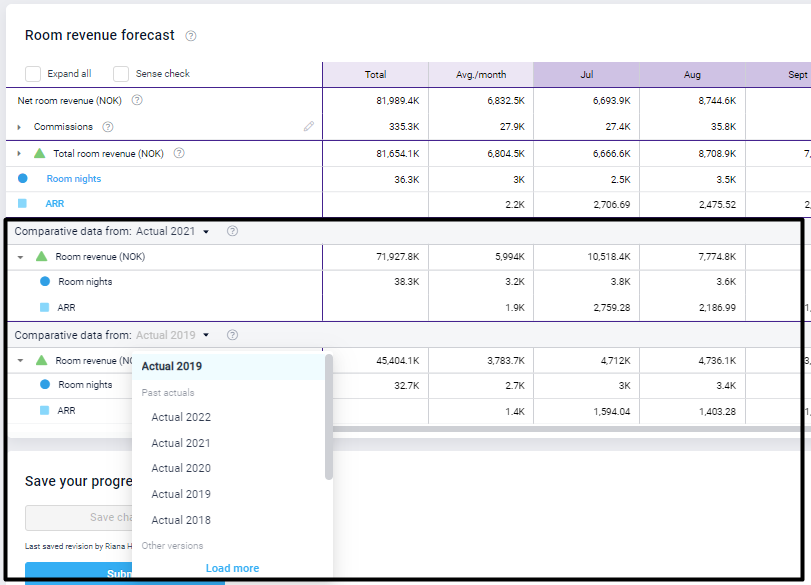
There are two purposes for the Comparative data:
The 1st set of Comparative Data shows Last Year as the default (in this case: Actual 2021).
The default for the 2nd set of Comparative Data is selected by the Admin User when setting up the current plan.
The drop-down list enables you to select a different time-period for either Comparative Data set. This enables you to make comparisons quickly without leaving this page. The charts will also update to display the new selection.
By default, the second comparative will show the dataset used for pre-populating splits between accounts, level of commission or anything else not available from Live Forecast. This comparative is selected by the admin user as part of setup for each version.
Further details about the Comparative Data selection can be found in the article COMING SOON: Room revenue planning Comparative Data explained.
The segment page details the underlying Room revenue data which is held at Segment level in the Live Forecast for your chain or property.
The totals and comparatives are still available on the Revenue page.
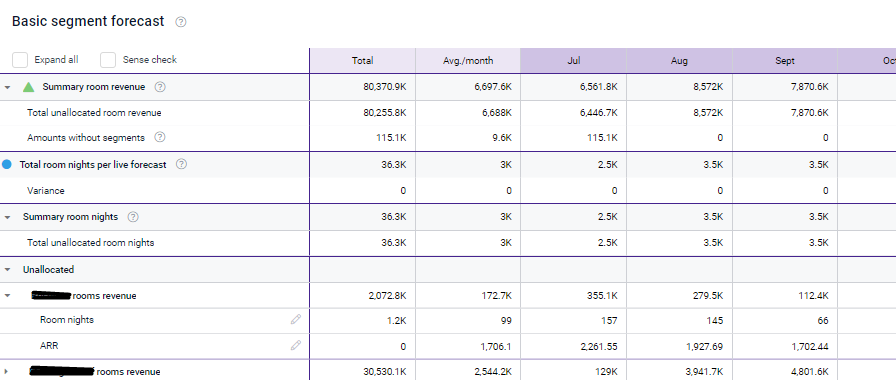
Where the current plan has been set to allow editing of the data at Segment level, this will be done in the Segment page only and not in the Revenue page.
Editing the segment page automatically updates the Revenue page including any charts.
The layout and functionality of the Segment page follows the same principles as the Revenue page.
For details on how to Set up Segment Groups and Segment Mapping see the article COMING SOON: How to set up a Plan: Segments and Segment Groups.
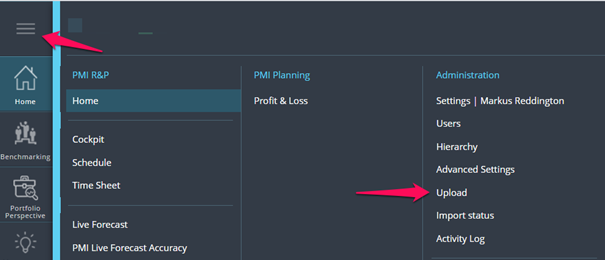
In PMI you can upload your budget, forecast and actual data,. The Upload function is found in the main menu under the Administration column. From the Upload module, you can download an excel template where you enter or copy/paste data from another system and upload directly into PMI.
When you enter a new month, the forecast/budget will lock for the current month. In most cases, this is a request from your Head Office to avoid accidental or unauthorized changes that conflict with the data submitted to your reporting system (SAP).
Your task is now to work with the Live forecast on a daily level to ensure that your departments are updated with the latest expectations. An accurate Live forecast allows the departments to be better prepared for what is happening and staff accordingly.
To check the hours imported from a time keeping system for a specific date or period, click the plus sign next to the date double, click on time keeping system hours. A list will appear with an overview of the number of productive and non-productive hours imported from which department, position, and category (depending on the settings in your time keeping system). You can also hover over the date of choice in the graph to see the split categories.
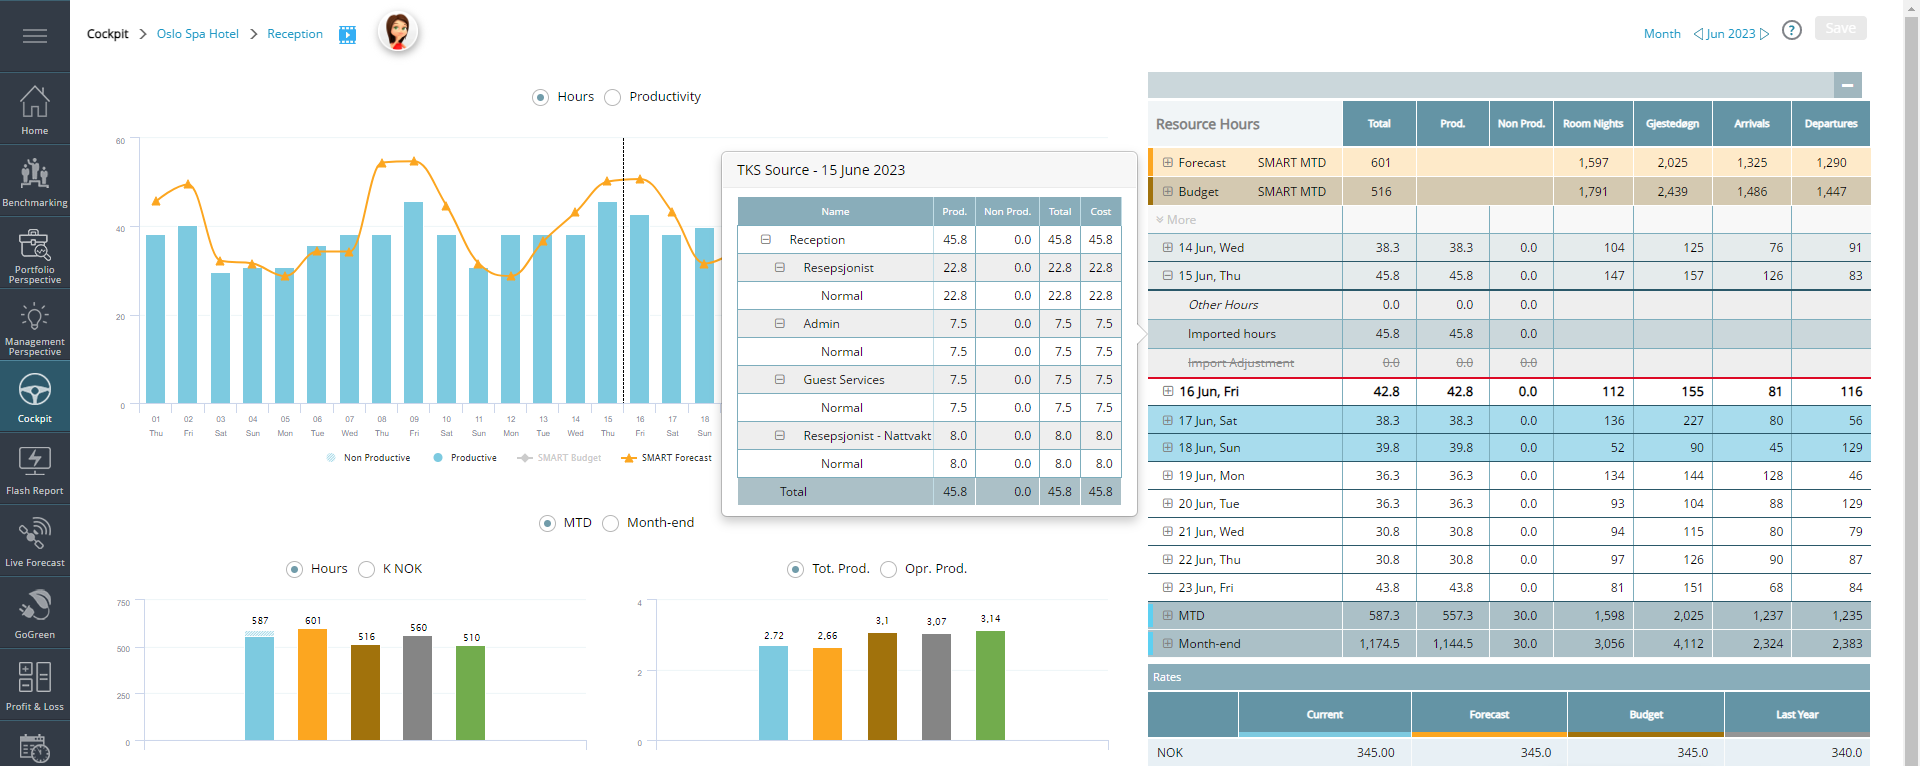
The rates that you see in the cockpit are picked up from the Budget & Forecast module. In the Budget & Forecast module, you can enter either the rate or total labor cost, depending on the settings chosen.
If you work with total labor cost, the labor cost percentage rate in the cockpit is found by dividing the forecasted/budgeted cost by the forecasted/budgeted hours.
If you work with rates in Budget & Forecast, the same will appear in the cockpit. The current rate, is by default, the same as forecasted but can be amended directly in the cockpit if necessary. Budgeted and forecasted rates in the cockpit can only be changed if you are working with rates in Budget & Forecast, otherwise, these are closed for editing.
Click here to read more about labor costs.

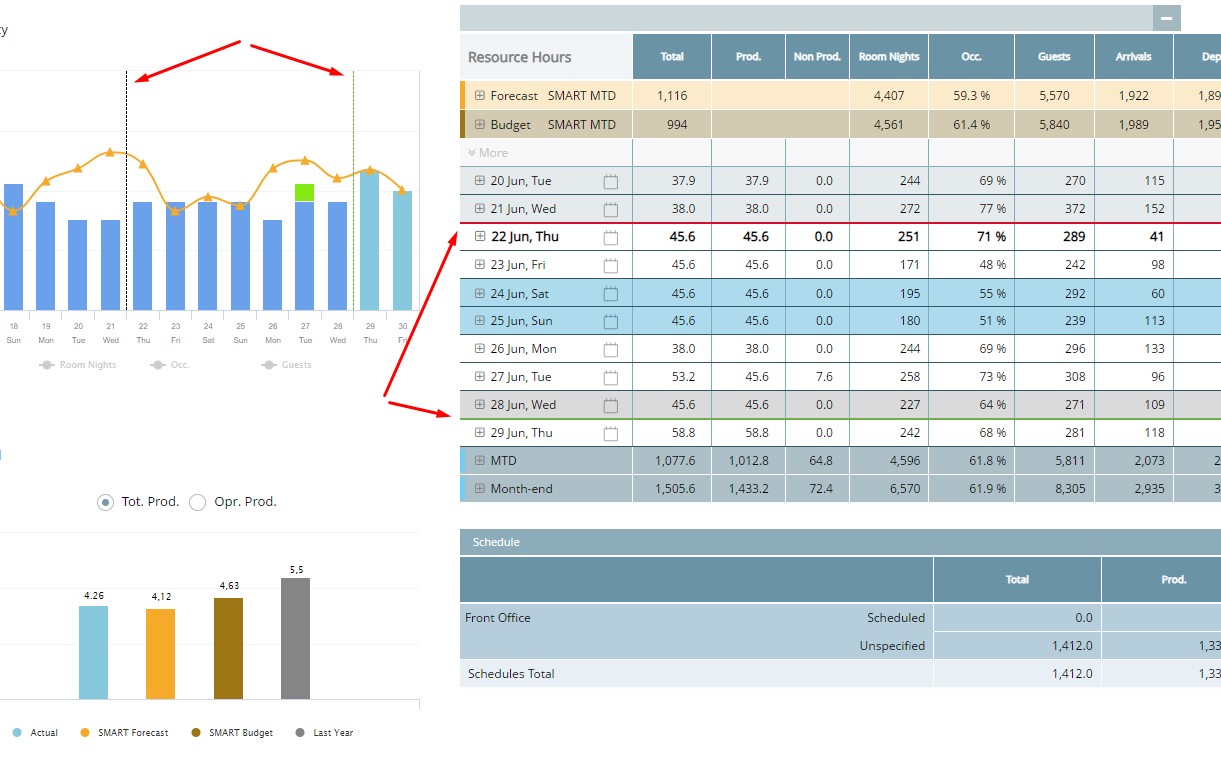
Reaching the monthly productivity target is your key goal. Keeping the blue hours bars as close to the yellow line (SMART Forecast) as possible means that you are achieving your daily productivity target. Keep in mind that this is not always possible or desirable for all departments. This will depend on the type of daily activity you have in your department, as groups or individuals such as kitchen and M&E Ops are often “producing/preparing” before guests arrive and revenue is posted.
You can always see the actual/planned, forecasted, budgeted and last year’s productivity in the graph on the bottom right side of the cockpit. By choosing to see month-to-date or month-end, you will see where you are and where you are likely to end up, with the current schedule and expected activity (live forecast).
The yellow line in the upper graph is your productivity guideline. This takes the daily live Forecast and divides it by the productivity target (forecasted productivity). The closer the blue hours bars are to the yellow line, the closer you are to your target.
If blue bars are below the line, you are using less than your expected hours, i.e. you are being more productive than expected. If the bars go above the yellow line, the opposite is the case. If you are consistently under or over the line, you may have set an unrealistic target. This target should not be changed during the month, but acknowledged and taken it into consideration when planning the productivity forecasts for coming months.
When there are larger discrepancies between the actual and expected productivity, take note of the reasons why. How did the workload effect service and production level?
Dates to the left of the black line are historical, and planned/scheduled hours are on the right side.
In the cockpit, you will see three columns displaying hours. Total, Productive and Non-Productive. Productive hours are hours that have been worked and payed for. Non-productive hours are payed hours that have not been worked. Productive and non-productive hours added together will give the sum of the total hours.
When room revenue is temporarily depressed due to event shifts or unexpected changes, F&B departments can still set realistic monthly targets using the following approaches:
Note: Productivity targets must be set before the month starts — you can’t adjust them mid-month once locked. However, you can still adjust Live Forecasts and scheduling to reflect changing conditions.
Productivity is calculated by dividing the output in a department (i.e. revenue, rooms occupied, covers) with the number of hours paid for. We differentiate between total productivity, that takes the output divided by the total hours, and operational productivity, that takes the output divided by productive hours only.
Example in housekeeping: If 100 rooms are cleaned in 50 hours, the productivity is 2. [100(output)/50(hours) = 2(productivity)]
Some departments, such as admin & general and sales, are assigned a fixed number of hours each month regardless of occupancy or activity. These fixed hours may be evenly distributed across weekdays for that particular metric. However, note that the yellow line in the cockpit represents the SMART forecast—not the fixed hours. While fixed hours might be allocated uniformly, the overall hours graph often shows a curved pattern, and productivity trends, although sometimes nearly linear, aren’t necessarily a straight line by default.
Productive hours are paid hours for work connected to a department. Non-productive hours are a paid absence, i.e., there is a cost for the hours although they have not been used for regular work in the department. This could be sick leave paid for by the property, trainings, meetings, etc.
Vacation days/paid time off for full time employees should be ignored in PMI. Paid time off is accrued every working month during the year. When an employee takes their paid time off, there is no additional cost to the hotel for that month because it has already been set aside.
Rates are average total labor cost per hour in the department (cockpit). It should include taxes and social charges. These are calculated by dividing the total labor cost by the total number of hours worked.
A cost driver is an operational factor in the department that effects the need for labor, whether that is guests, rooms or revenue. For example, Housekeeping uses rooms occupied last night as a cost driver, because that determines the amount of rooms needing to be cleaned today. The more rooms that must be cleaned, the more labor is needed. In Kitchen, the total food revenue is considered a reasonable measurement to consider the need for labor.
The cost driver is displayed next to non-productive hours in the Cockpit. The columns following the cost driver are for information only and do not affect productivity.
Click here to read more about the Cockpit cost driver.
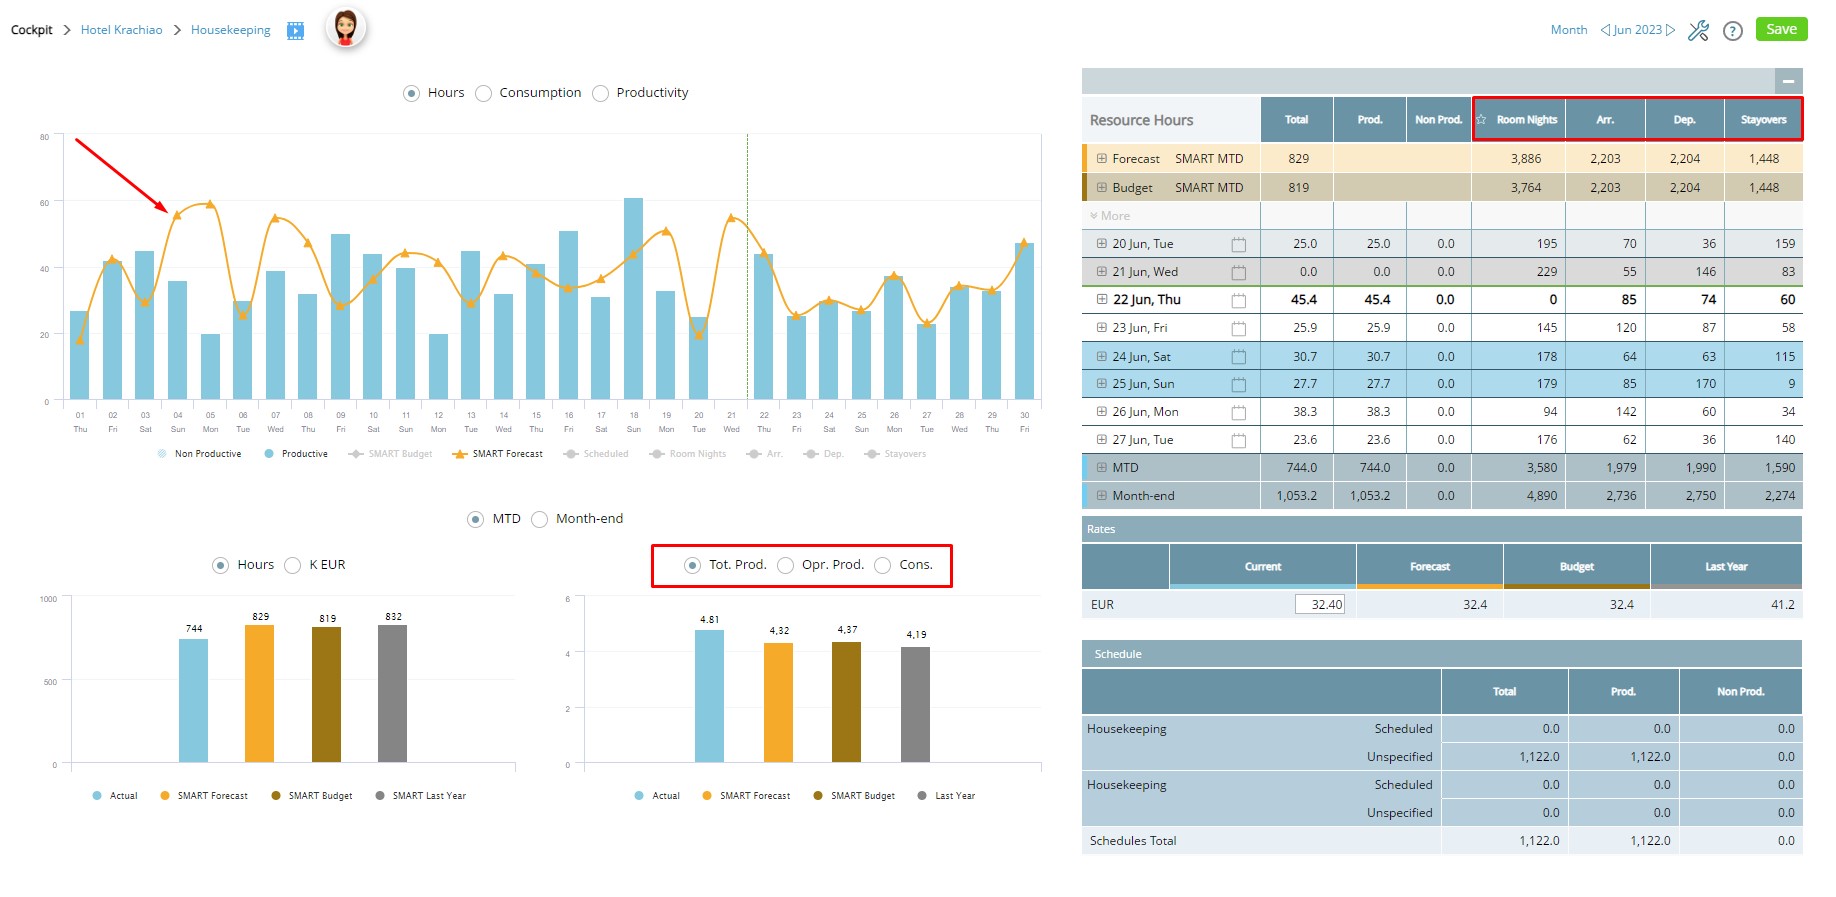
The Min and Max settings allow you to set the minimum and maximum hours required in a department for each day of the week. Using this function will affect forecasted productivity, as you are manipulating hours needed on slow and high activity days. Consider this carefully before activating these settings. You can activate Min, Max, or both, depending on your needs.
As a general rule, minimum hours are the hours needed if the hotel has only one room occupied. This is sometimes used for departments like Front Office, which must be manned 24 hours regardless of occupancy.
Maximum hours represent the maximum number of hours in a day if all employees in a department are working the maximum possible hours (including overtime if allowed). This is often used for departments such as Kitchen or M&E Operations, which can experience very high revenue on certain days but still have a limit to how many people can work.
Note: Adjustments to Min/Max hours are applied to the selected year globally, not on a month-by-month basis. Ensure the correct year is selected before making changes.
Click here to read more about Min/Max settings.
The SMART forecast in PMI is a daily breakdown of your monthly productivity/hours forecast. The SMART forecast allocates the month forecast to each day based on the expected activity levels of hotel using the cost driver forecast and historic staffing patterns. This can be used to plan staff schedules in line with the monthly forecast.
Click here to learn more about SMART.
The planned hours in the time keeping system are only calculated for the length of time that the Schedule Horizon is set. After that, PMI uses the SMART forecast suggested hours.
Horizon days are used beyond the period you have scheduled in your time keeping system (changing the days in the Scheduled Horizon does not affect the import of hours from your TimeKeeping System). If you usually make the schedule 10 days in advance, the horizon should be set to 10 days. After this PMI will suggest a schedule based on your forecasted productivity target and Live forecasted cost driver (output).
Your schedule is visible between the red line (today) and the green line (schedule horizon), after which there is a SMART schedule.
If you have a schedule that extends beyond the the schedule horizon, you can click on the schedule to see this in the graph or extend the horizon days.
Short answer:
Month-End productivity is your goal, while MTD productivity shows your current progress—so they will naturally differ during the month.
This difference is expected and comes from how SMART calculates and distributes hours across the month.
When the cockpit is locked on Productivity, the selected value (e.g. 2.29) is a month-end goal, not a value applied to each day or MTD.
In the cockpit, Month-End (ME) represents the goal, while MTD shows your current status, which can vary during the month.
The locked productivity defines the total SMART hours for the full month, based on the full-month cost driver (e.g. room nights).
As a result:
MTD SMART productivity is recalculated using only the days that have passed:
Because this uses a subset of the month, it will not necessarily match the locked month-end SMART productivity.
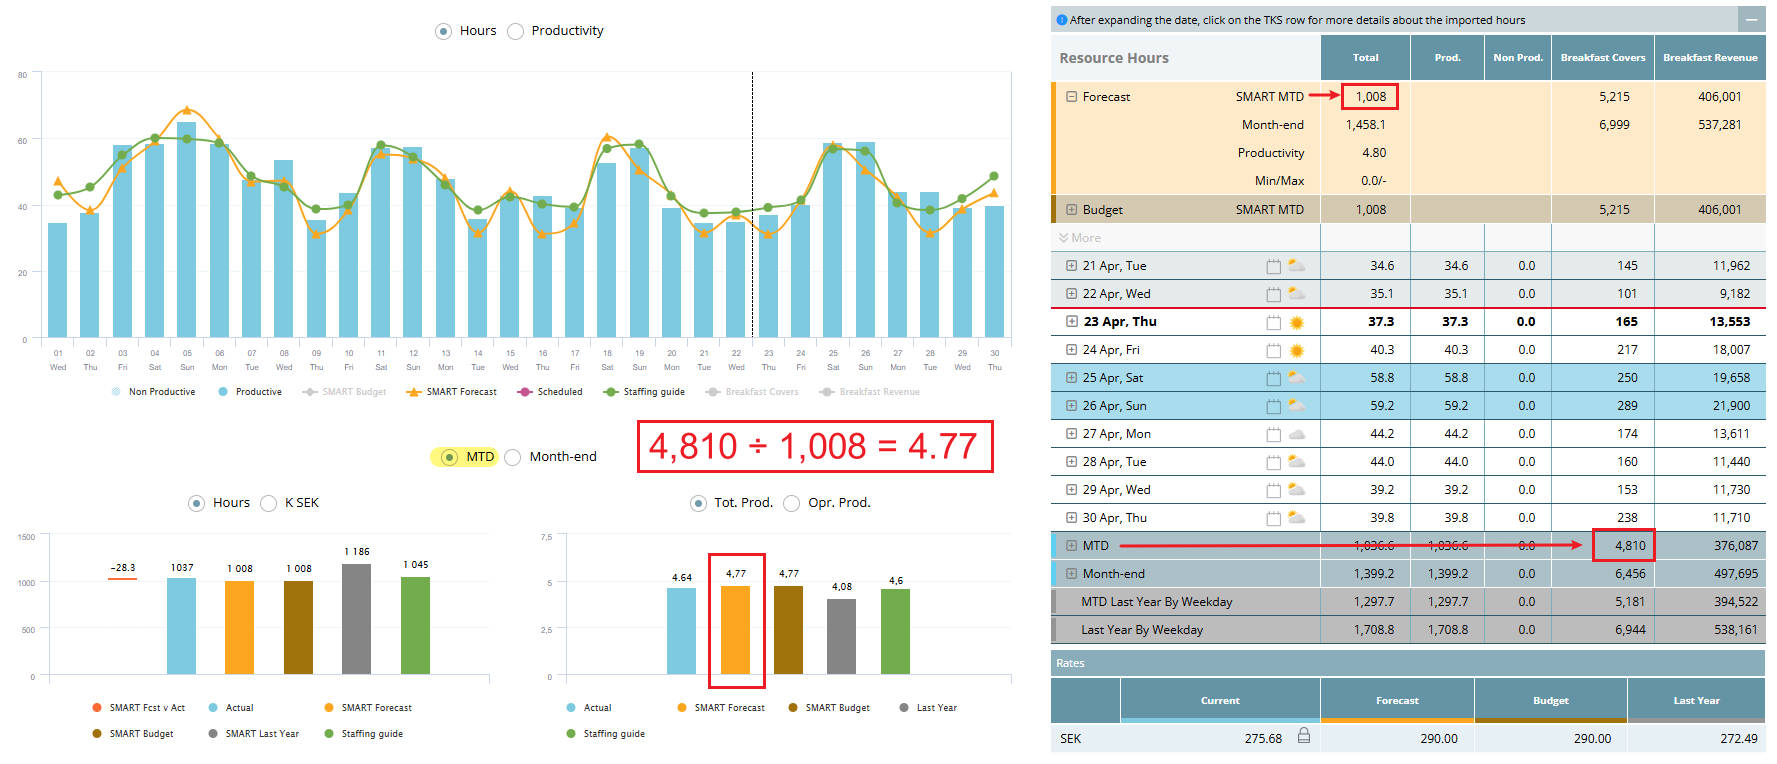
MTD productivity is calculated using MTD cost driver (4,810) divided by MTD SMART hours (1,008), resulting in 4.77.
SMART distributes monthly hours day-by-day using operational patterns, not in a straight line. This includes:
As a result, the mix of hours and activity in the first part of the month (MTD) is rarely a perfect “mini version” of the full month, causing the MTD productivity to drift above or below the locked value.
A common scenario for a housekeeping department:
This reflects a typical operational pattern, where work is intentionally shifted between days. SMART’s machine learning identifies these historical patterns and uses them when distributing hours.
Viewed per day, productivity may look extreme. Across days, the total hours and cost remain aligned with the plan.
The cockpit is only a mirror of what is imported from your timekeeping system. The first thing you need to check is whether all hours have been updated/confirmed/approved in your timekeeping system. Incorrect mapping could be another reason, or there are departments or categories that are unmapped, ignored or mapped to the wrong place. It will be evident in the cockpit if this has happened.
Click here to read more about timekeeping system mapping.
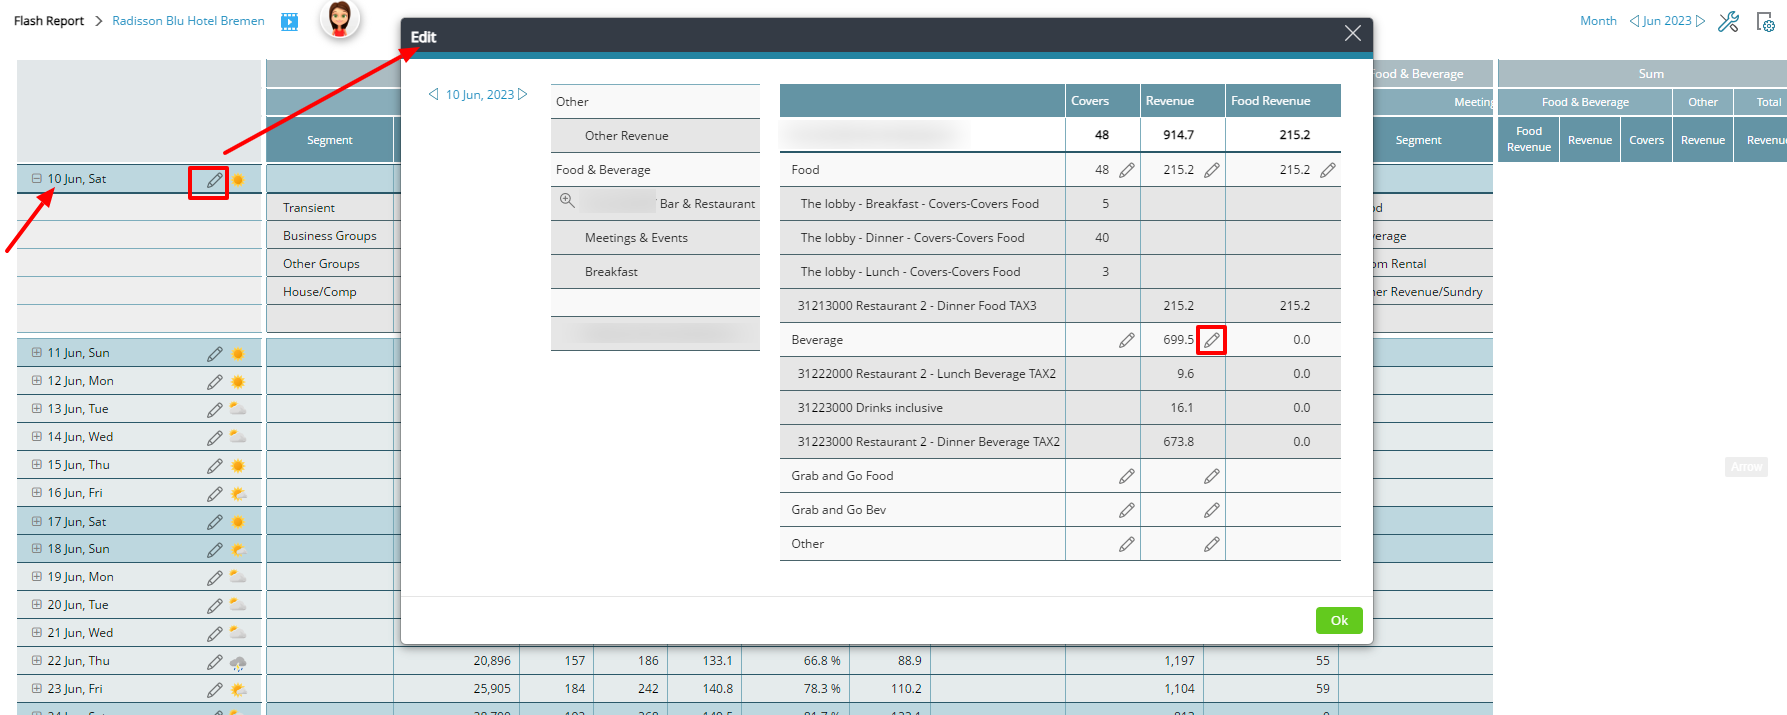
You can edit the revenue in the Flash report for past days by clicking on the pen next to the date.
One reason for editing could be that revenue was registered on a wrong day in PMS or POS. In order to get correct historical data, you may remove that revenue from one day and add it to another day. You may also use this function when entering data manually, i.e if you don’t have an integration to a PMS system.
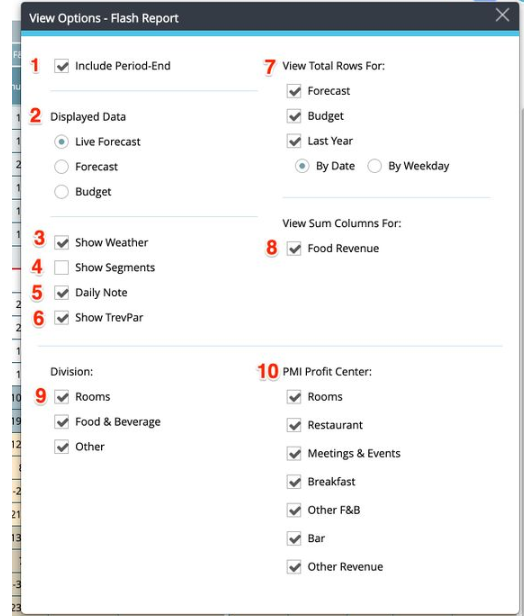
1. Include Period End − This will include Live forecast.
2. Displayed Data − You have the option to see Live forecast, and can compare actual and Live forecast figures, Forecast figures (last submitted forecast) only and Budget only. The summary at the bottom will always show actual and Live forecast figures.
3. Show Weather − If chosen, you will see a forecast weather icon for the next 10 days. The weather forecast is saved and stored for passed days.
4. Show Segment − This will display the segments in each department. You can also open the segments by clicking on the + sign in front of the date in the main view.
5. Daily Note − Will display daily notes/comments made in Live forecast.
6. View TrevPar – will add a column under Rooms displaying TrevPar (Total revenue per available room0. This is found by dividing the total revenue by all available rooms.
7. View Total Rows For Forecast, Budget and/or Last Year − This will add comparison totals at the bottom of the page. When comparing to Last Year, you can choose between By Weekday (then PMI will compare to the same period last year, i.e not the same dates but the same weekdays) and By Date (PMI will compare the exact dates).
8. View Sum Columns For Food Revenue − This will show the Food Revenue both under the column Food & Beverage and under the column, Other, if applicable.
9. Division − This enables you to select viewing a certain division only.
10. PMI Profit Center − You may also select what to display at the profit center level.
The flash report will display a percentage ratio of how you are doing month to date and month-end vs Forecast, Budget and Last Year for each revenue center.
The Forecast index is calculated by taking the month-end figure and dividing it by the forecast figure. The index indicates where you will end up month-end compared to the forecast. The deviation is also displayed in local currency.
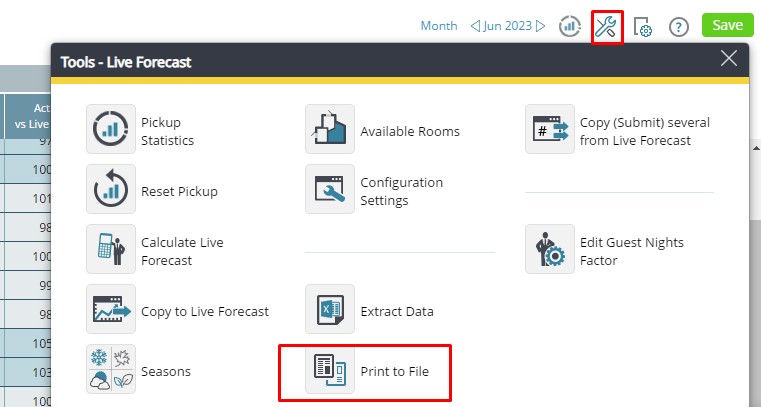
You can print the data found in the Flash report. Choose “Print to File” from the tools menu. You have the option to choose PDF format or Excel.
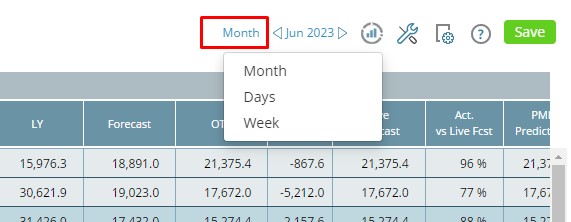
Click on the period-type next to the date at the top right of the module, and select days, month, several months or year as your view option.
Then choose the period interval you want to review.
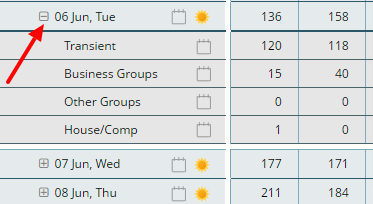
In the Flash report, if you click the + sign beside a date, you will open a summary of the segments that add to the total.
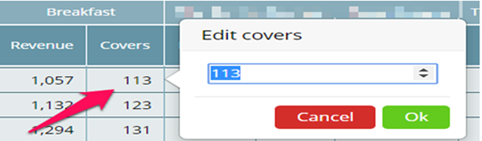
The easiest way to edit covers is to double click on the covers for the day, enter your number and save. If you have more than one segment in the revenue center, you must click on the plus next to the date to open the segment. This function must be activated through settings in Live Forecast. You need specific user rights to update covers.
Another option if the function above does not work you can use the Pen to manually edit
The MTD (month-to-date) forecast is the amount you should have by this point in the month/period, in order to reach your end-of-the-month forecast, given that your Live forecast for the rest of the month is correct.
The calculation is: ME (month-end) forecast divided by month-end Live forecast multiplied by MTD actuals.
In the example below, reflected in the screenshot:
A. ME Forecast: 58,571
B. ME Live forecast: 56,430
C. MTD Actual: 7,314
D. A (58,571) divided by B (56,430) multiplied by C (7,314) = MTD forecast (7,591)
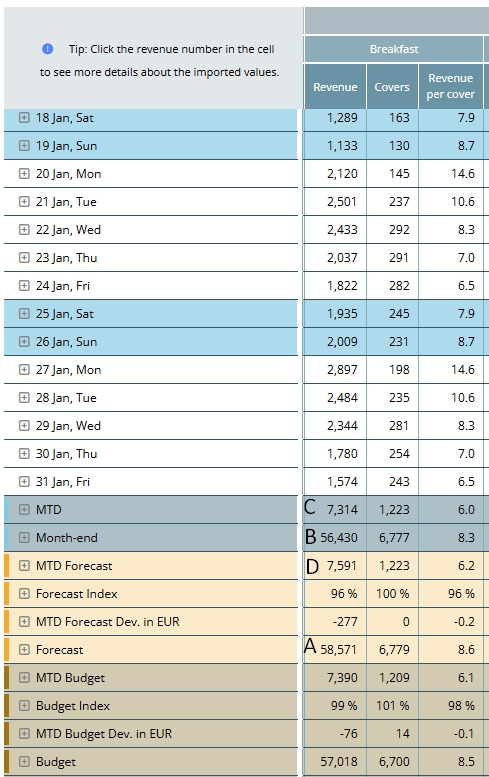
Image description: The Flash report in PMI with method for calculating MTD forecast/budget
Note: If the MTD actual is higher than this amount you will exceed the forecast and vice versa. The Forecast index is calculated by taking the month-end figure and dividing it by the forecast figure.
The index indicates where you will end up at month-end compared to the forecast. Deviation is also displayed in local currency.
The above calculation works the same way for Budget: Month-end Budget divided by month-end Live forecast multiplied by MTD actuals.
The Flash report is a daily updated operation report that gives you an overview of all daily, month-to-date and month-end revenue for all departments in PMI. Month-to-date and month-end figures can be compared to Forecast, Budget and Last Year.
Account mapping details can be found in the Flash report.
In the Flash report, when you click on the MTD total toward the bottom of the page, a popup will appear where you can see a complete breakdown of the values that were imported from the source for all the days MTD in that month.
What is displayed:
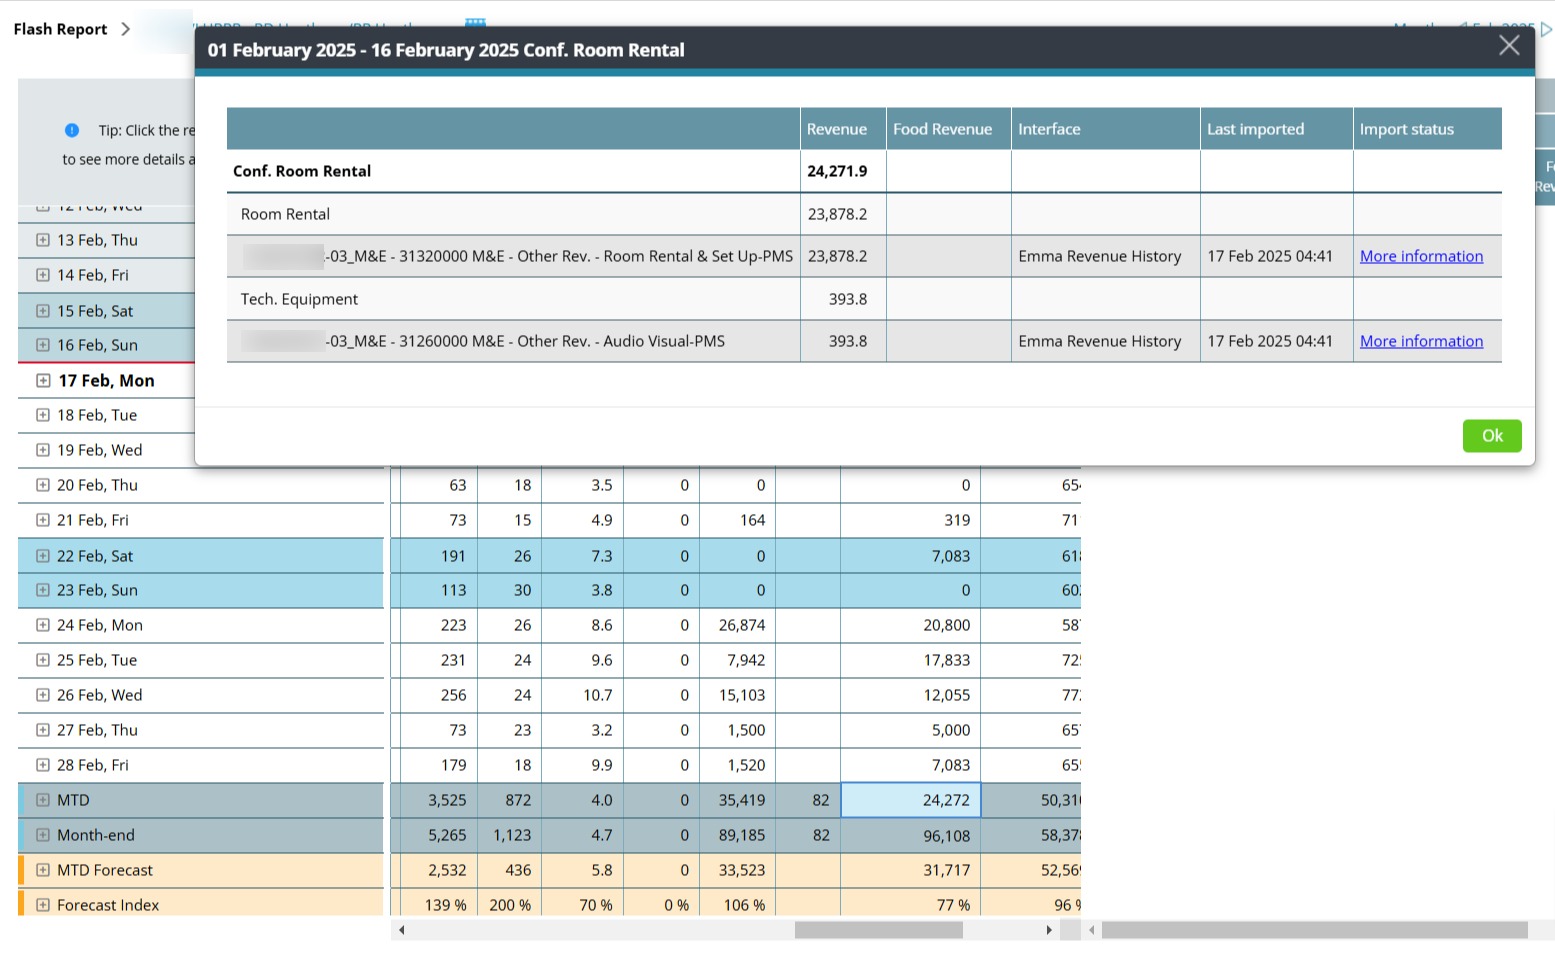
The same logic applies to values on historical days – on day level, and OTB values in the Live forecast module.
Click here for more information on the Import status.
Click here for more information on the Flash report.
A common source of deviation when room/guest night is wrong can be because of:
If a profit center in the Live forecast is set to automatic driver, that driver can change from day to day. It is important to look over the figures in the Live forecast every day, and if they look good, click Save.
The last saved version from the Live forecast are the figures that are shown in the Flash report.
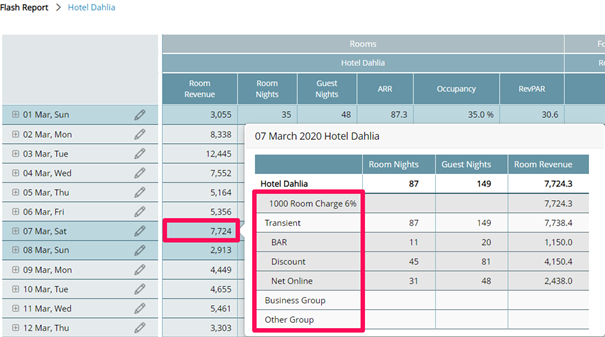
By clicking on any actual figure (historical), a popup will show you the import from your PMS or POS system with the actual accounts imported, as well as revenue. You will then be able to quickly identify what is missing or wrong.
Another reason could be that revenue has been posted outside Opera, i.e. in the accounting system and should, therefore, be added manually.
Opening Inventory + Purchases = the Cost of goods available for sale (COGAS)
COGAS x Cost percentage = Cost of goods sold (COGS)
COGAS – COGS = Closing inventory
Your Opening Inv. Is 50.000€ + Purchases of 10.000€ (MTD or Month-end) = 60.000€ (COGAS)
60.000€ x 30% food cost = 18.000€ (COGS)
60.000€ – 18.000€ = 42.000€ (Closing inventory)
1. Make sure you are looking at the correct period, MTD or Month-end.
2. Are opening and closing correctly inserted?
3. Are purchases entered correctly?
4. Verify that food revenue is correct.
5. Please check with your financial controller if something is incorrectly mapped, as some revenue may not have been registered.
Turnover days that are greater than 10 indicate that the amount of stock is higher than your business need.
Fewer turnover days means that you are selling your food quickly and often indicates less waste and lower food cost. The recommended number of turnover days is 8, plus or minus 2 days.
Is your opening and closing Stock calculated correctly? See: How do I estimate my Closing Stock
1. Enter the total value of your food purchases as a lump sum in the Purchase column on the day they are delivered, excluding VAT.
1. Update your closing stock by inserting your estimated stock value (See: How do I calculate my Closing Stock)
2. Check if your actual food cost percentage and your forecast are aligned, and make sure your purchases and the upcoming business are aligned.
1. Enter your closing stock from last month. This will automatically populate the opening stock in your current (new) month.
Manually enter the total value of your food purchases as a lump sum in the Purchase column on the day they are delivered, excluding VAT.
Closing stock is your inventory or estimated inventory, if you do not have a counted stock account.
Opening stock is the closing inventory from last month.
Fewer turnover days means that you are selling your food quickly and often indicates less waste and lower food cost. The recommended number of turnover days is 8 days, plus or minus 2 days.
Turnover days is how many times an average stock is being converted into sales. Fewer turnover days means that you are selling your food quickly and often indicates less waste and lower food cost.
Opening inventory + closing inventory / 2 = average inventory
Opening inventory + purchase – closing inventory = inventory used
Average inventory/inventory used = turnover ratio
Days in the month/Turnover ratio = turnover days
Go to the navigation menu, choose Budget & Forecast and select your cockpit. Here you can insert or update your forecast and budget for food cost and percentage.
1. Keeping track of opening and closing stock helps head chefs to efficiently manage and control their stock to minimize the risk of waste, track product value and optimize quality and food cost.
2. With a record of opening and closing stock, the food cost will be more accurate.
PMI includes a Period Locking function that allows Revenue Managers or Head Office personnel to lock values after a specific date.
What is Period Locking?
Once a period is locked:
In the PMI Index, hygiene factors are foundational tasks that ensure operational routines are being followed so that PMI performs well.
The plan is pre-populated from two main sources when initially created.
The final step creates the prepopulated pages for the budget holders to review and edit. When you press the Save button, PMI will create a set of plan pages for the period specified with the name you chose. Adjust the title to refer to it as a budget, forecast or target, as specified.
It will take a copy (snapshot) of values in the Live forecast at that point, and use them to display the usage/consumption values in the plan pages. It will also take the set of comparative data specified and display it in the comparative data section of the plan pages.
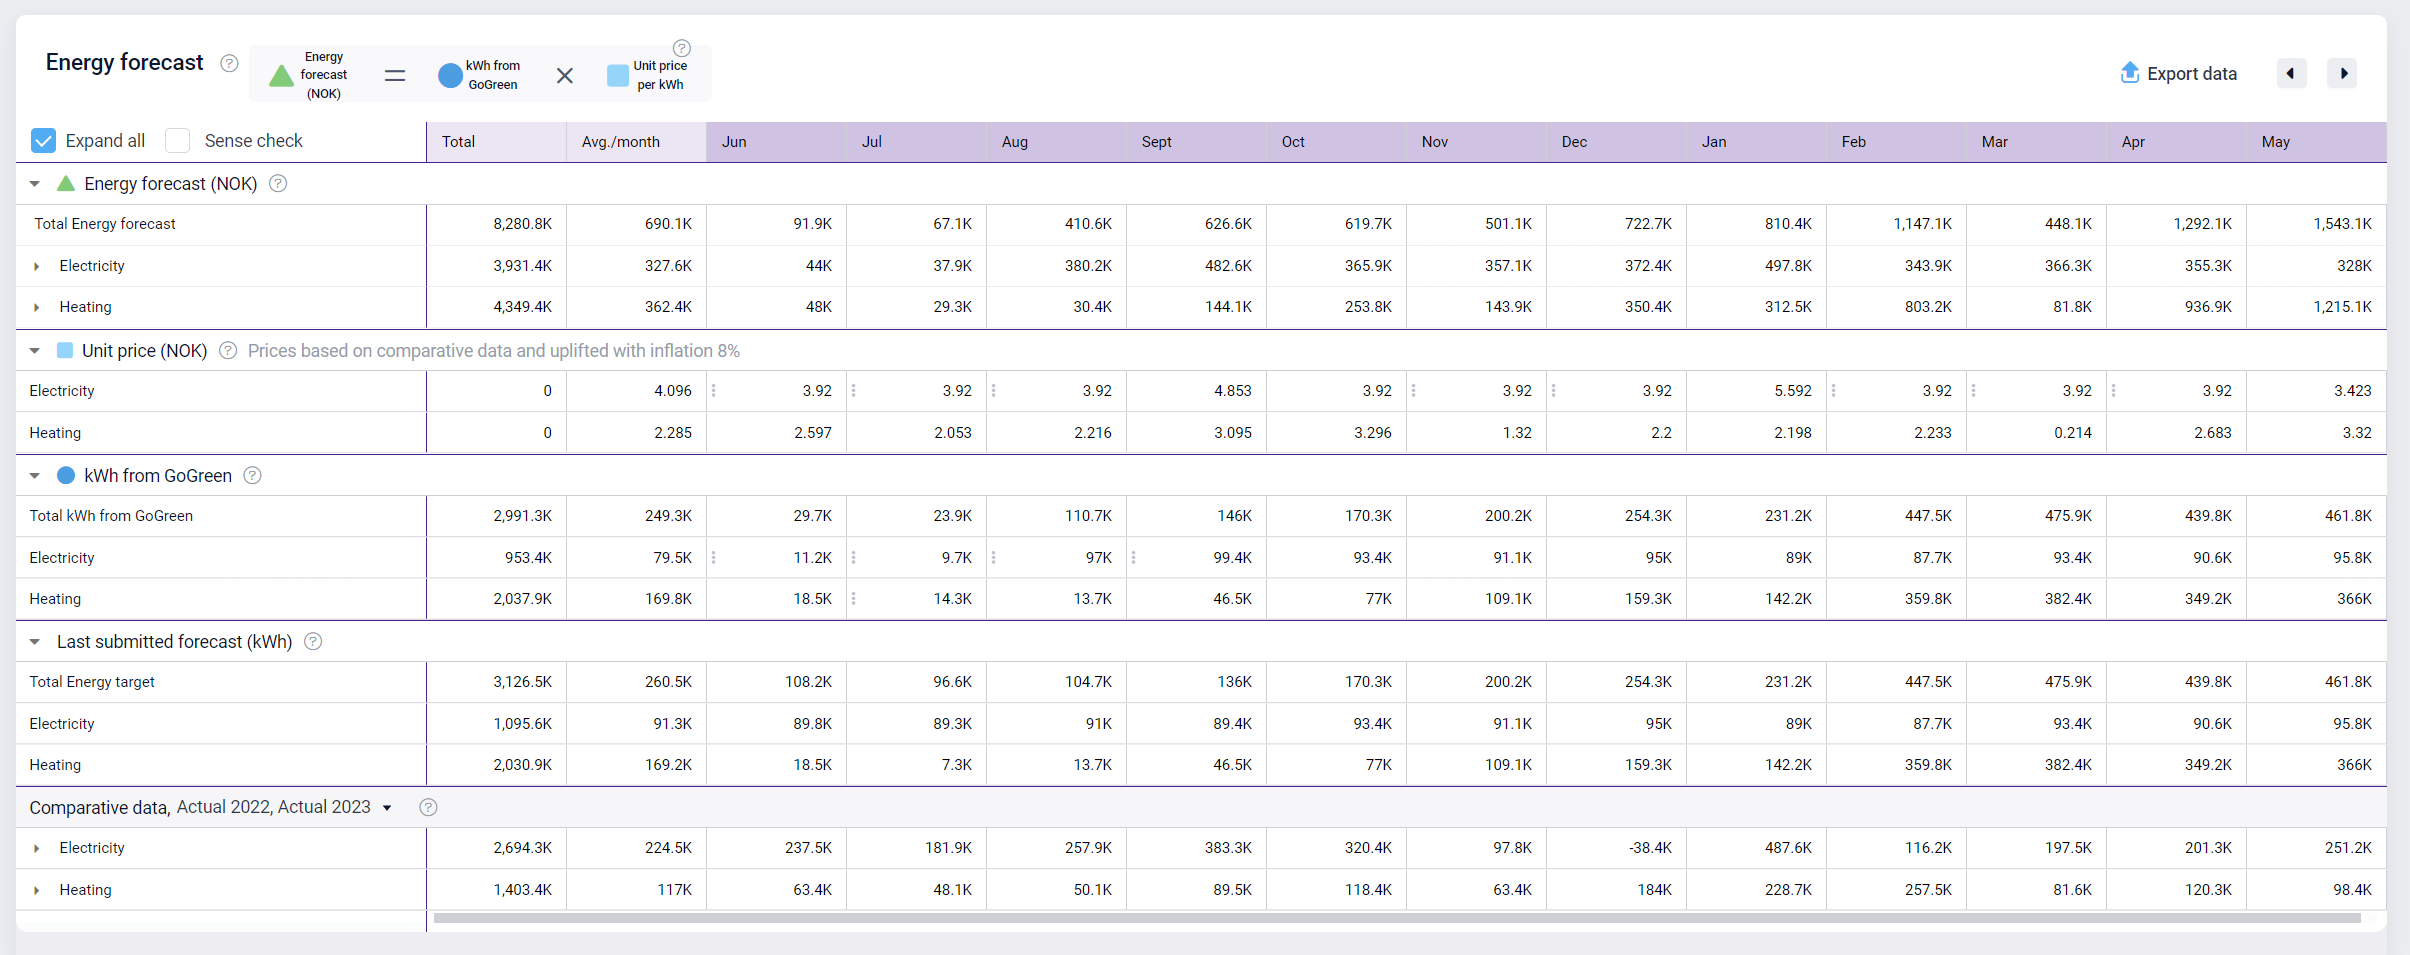
It will also use the comparative data and any other settings like the inflation % to calculate the unit prices to use in the price section. The new plan pages will then be prepopulated with a starting point for all cost items and months that have historical data and a forecast activity level in Live forecast.
It is a fancy name for a set of data you are comparing your draft plan against. The dataset shown under comparative data is also used to calculate other elements of your new plan. Look for ‘based on comparative data’ in a section header like this:
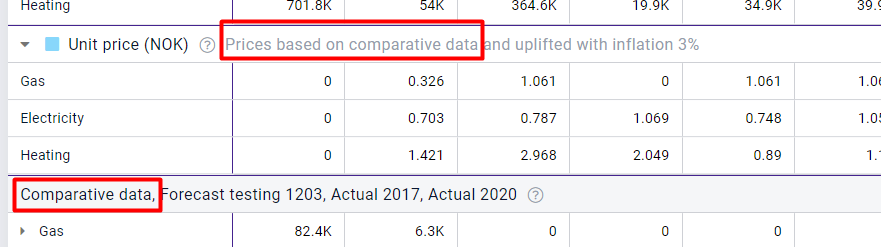
Comparative data is often just last year’s actual costs for the department and cost type we are looking at. We have given it a general title because the admin user doing setup can choose what the plan will be compared to, and can also mix and match several sources as in this example.
When doing the setup, the admin user can choose between actual data from any past year that is in PMI and any of the previous forecasts/budgets created through the planning module. As a forecast file can be longer than one year they can also use multiple sources to cover all the months.
Set up and activate a new plan when you need to pick up the latest information from Live forecast. A snapshot of Live forecast is taken at the point the plan is created.
While you can submit a plan to cockpits at any point to pick up the latest pricing in cockpit targets and cost forecasts this will not incorporate new updates to Live forecast.
So, it is recommended to establish a regular schedule for focusing on rooms/revenue forecasts, then other drivers/cockpits and then taking the snapshot before focussing on the financial elements.
All data in previous months is actual data. There is no need to make an estimate for something that has already happened. If you need to make a change to the data because it is incorrect, you need to ask to have the period unlocked so that the corrections can be made. See the article Period locking for more details.
If direct changes are made to the plan rows, then the whole link to a usage and a price will be broken and we will not be able to prepopulate future plans correctly.
The best practice is to change the unit price, if possible. The prices initially shown are estimated using historical information, and are the most likely source of any errors.
If you know the total cost for the month, then divide that by the expected usage shown to find the unit price that will give the value you want. The diagram below should help with how the formula shown at the top of the page can be used to work out other values.
The green plus sign means that the Cockpit is updated and is using fewer hours than the forecasted productivity target or hours, month to date.
The yellow question mark means that the Cockpit is not updated. Best practice is that all Cockpits should be updated before 10:00 each morning.
The red minus sign means that the Cockpit is updated, but more hours have been used than the forecasted productivity target or hours, month to date.
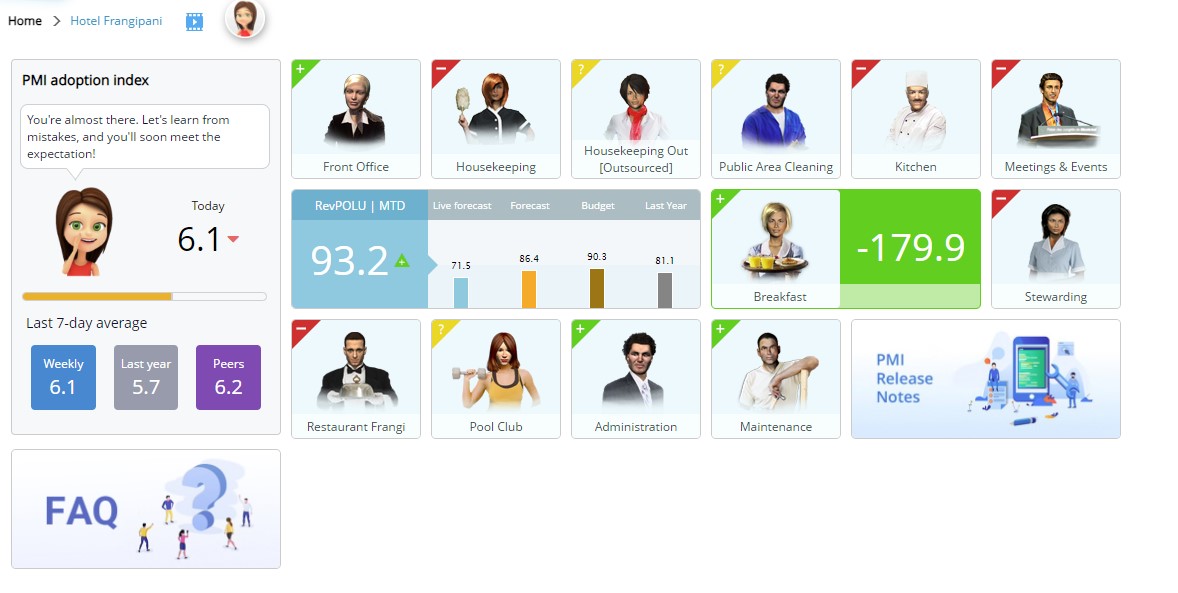
RevPOLU stands for Revenue Per Operational Labor Unit, and is the total revenue earned per paid labor hour. It is calculated by dividing the total revenue from all profit centers by the total number of hours worked, both productive and non-productive, at a property.
You can see a more detailed explanation in RevPOLU in this article.
The PMI adoption index, as it is called now, measures your resource and productivity management skills on a department level. The score indicates how well your productivity management skills and habits are according to PMI best practices. A PMI adoption index score of 8 out of 10 is good, while 8.5 or above is considered great.
Click here to learn more about the PMI adoption index.
ARR stands for average room rate while ADR stands for average daily rate. ARR and ADR are the same when looking at a single day, but they differ when looking at a period total. ARR is used within PMI as it is more relevant when looking at a longer period of time. Using ARR gives a better view of the period, as otherwise, days with low room nights will skew the period result.
Please see the chart below for more details.
Example – One week of actuals:
|
Room nights sold |
Room revenue |
Average (ADR/ARR) |
|
|
Monday |
75 |
75,000 |
1,000 |
|
Tuesday |
100 |
120,000 |
1,200 |
|
Wednesday |
100 |
120,000 |
1,200 |
|
Thursday |
85 |
93,500 |
1,100 |
|
Friday |
60 |
48,000 |
800 |
|
Saturday |
80 |
72,000 |
900 |
|
Sunday |
10 |
4,500 |
450 |
|
Total |
510 |
533,000 |
|
|
ARR: |
1,045 |
= 533,000 divided by 510 |
|
|
ADR: |
950 |
= 1000+1200+1200+1100+800+900+450 divided by 7 (days) |
|
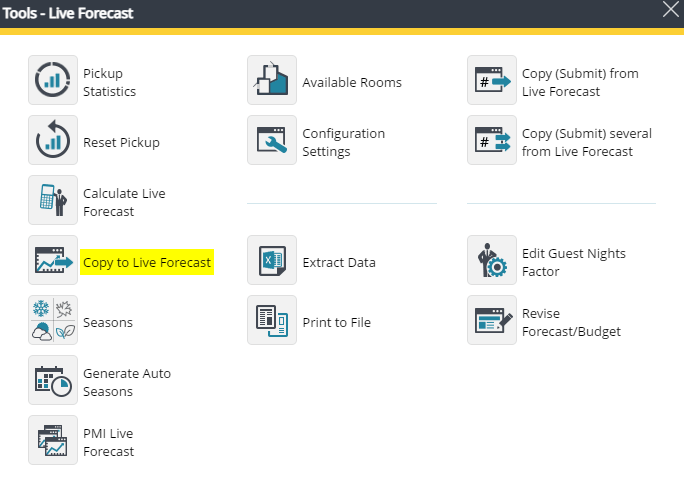
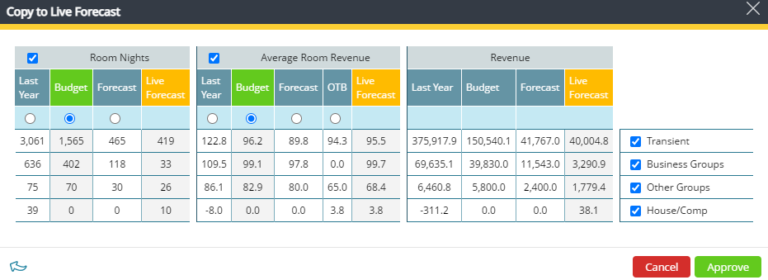
You can sync your current Live room forecast with last year’s data, the budget, or the most recent forecast you submitted. To do this, click “Copy to Live forecast” in the Tools menu of the Live forecast module. You will then have the option to choose the source you want to copy from to update your Rooms Live forecast. The PMI algorithm will automatically break down the monthly figures into daily values by segments.
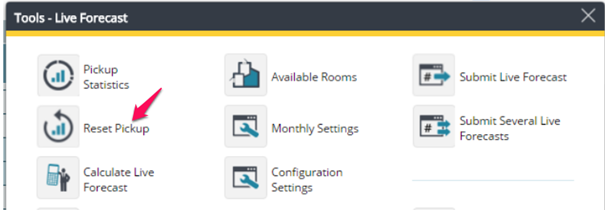
From the Tools menu of the Live forecast module, you can choose to Reset Pick up, which will zero out the pickup columns for the remainder of the month.
Alternatively, you can click on the calculator (or triangle) to the left of the date; a yellow hand will appear and the revenue driver will be disabled for that day.
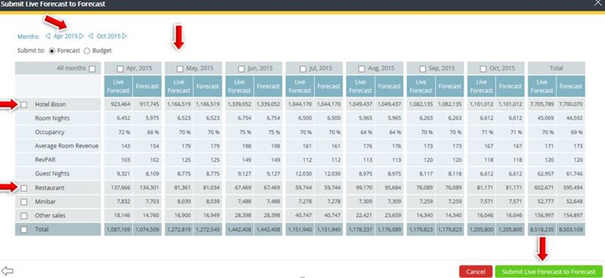
Every month, usually with a deadline of the 20th to the 25th of the month, you need to freeze the forecast for the coming month or months. That means that by the 25th of the current month you need to take an extra good look at the Live forecast for the coming months, and make any adjustments needed before going to the Tools menu and selecting Submit Live forecast as the Forecast for the next month. Once this has been submitted, it should not be changed once you enter that month.
You can choose to submit an individual month or several months at once.
Covers are the number of guests served in restaurants, bars, and M&E at some properties. Please note that beverages are not commonly counted as covers.
Pickup Statistics show how your on-the-books figures (booked rooms, rates, revenue, etc.) change over time. They help you track increases or decreases in different segments and provide insights into your property’s overall booking patterns.
You can access Pickup Statistics from the Live Forecast (e.g., Rooms or any applicable department with OTB) or directly from the main PMI menu.
By analyzing pickup trends, you gain a clearer understanding of how and when bookings change. This allows you to spot opportunities for rate adjustments, refine marketing efforts, and improve your operational planning to meet demand effectively.
Seasons in PMI are automatically defined periods that group together historical dates with similar booking behavior or activity levels. They help PMI make accurate forecasts by comparing upcoming dates with past periods that behaved in a comparable way.
Some dates behave abnormally — for example, due to one-off events like concerts, renovations, and some dates have inaccurate data due to for instance revenue adjustments from a previous date.
For future dates, the pickup column displays the difference between on the books/Revenue driver and the last saved Live forecast. In the pickup column, you can revise or adjust how many rooms/covers/revenue you expect to end up with each day, plus or minus, compared to on the books/revenue driver.
Historical dates display the difference between the actual outcome and last saved Live Forecast. A negative pickup for historical dates tells us how much we missed compared to what we achieved this day. If we have a positive pickup, we ended up with more than we expected.
A revenue driver is used to forecast/predict revenue or covers in a profit center. A revenue driver looks at what drives the revenue or level of activity in a department. Different departments can have different revenue drivers such as guests, rooms, and revenue.
When using a seasonal revenue driver, PMI uses an algorithm based historical patterns and seasonality to predict future revenue or activity.
When using a manual revenue driver, the property decides the factors that will affect what happens in a department and sets ratios to forecast. Some examples:
If you want to change whether you are working with a seasonal or manual revenue driver, please contact us in d2o and we will change the settings for you.
The forecast is your monthly target and expectation before entering a new month. This should not be changed during the month.
Live forecast is a rolling forecast that is updated regularly throughout the month, depending on your latest expectations due to changes in the market, new reservations, cancellations, etc.
Daily live forecast is also updated for the coming two-three months (or according to your company policy). When you get to the end of the month, the Live forecast for the current month is submitted to forecast, and will be the respective monthly targets for the next month and onward.
It is not expected to submit a daily forecast for the 4th month and onward, but a general expected total amount should be submitted. A credible Live forecast is crucial for production planning as this forms the basis for expected daily activities and is reflected in the SMART forecast (the yellow line) in the various cockpits.
A red triangle is related to the revenue driver. It highlights that for a specific segment, PMI does not have enough seasons or historical data to calculate the revenue driver.
In this case, PMI looks at the last 50 days to give a suggestion. If you have a new segment, PMI will sometimes not be able to make a suggestion because it does not have enough historical data. On days with a red triangle, you should have a closer look and manually edit the pickup, if needed.
PMI imports on the books figures from your PMS system every morning. There could be several reasons why the figures do not match:
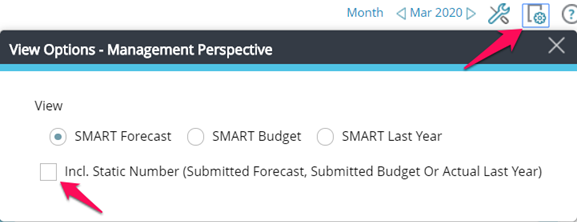
To see submitted Forecast, Budget or Actual Last Year, select “Incl static number” box in View options. An additional column will appear to the right of SMART, displaying the submitted Forecast, Budget or Actual Last Year, depending on the choice made.
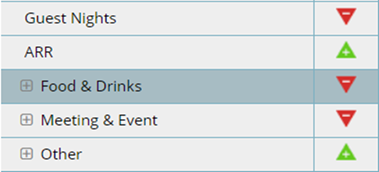
Key Performance Indicator (KPI) is a type of performance measurement. In PMI, a symbol is used to show the correlation of specific indicators to Forecast, Budget and Last year.
The direction of the arrow shows the trend compared to last year. An arrow pointing upwards means the KPI is performing better than last year, and vice versa.
A green arrow with a plus sign means that the KPI is better than the target, e.g. Forecast, Budget or Last year, depending on the choice of target.
A red arrow with a minus sign means that the KPI is worse than the target, e.g. Forecast, Budget or Last year, depending on the choice of target.
The GM Daily Digest is designed to be a concise, action-oriented snapshot for General Managers, emphasizing what’s changed, where the risks are, and what needs immediate attention. While many KPIs overlap with the Management Perspective view, the Digest presents them differently — with alerts, comparisons, and prioritization baked in.
Here are the unique or more prominent insights in the GM Daily Digest (compared to Management Perspective):
Waterfall GOP impact:
The Digest highlights where profit is rising or falling by showing both the percentage and currency deviation. This helps you see exactly which components are driving profit changes — something the regular Management Perspective view doesn’t emphasize as clearly.
Room Revenue (Occupancy vs. Rate):
It breaks down revenue motion into whether it’s being driven by occupancy or by rate changes. That clarity isn’t offered side-by-side in the Management Perspective module.
Month-End Forecast by KPI:
In the Digest, you’ll see a summary of whether each key forecast (e.g. GOP, Revenue, Productivity, Food Cost) is trending better or worse relative to the live forecast. The Management Perspective view may show similar data, but not in this streamlined, top-level summary format.
Missing Data Flags:
The Digest will immediately flag missing entries — e.g. if hours, food cost, or revenue inputs are not yet submitted. This ensures you don’t overlook gaps in your data. The traditional Management Perspective view does not call out missing data in the same way.
Start with the GM Daily Digest
Scan for off-pace KPIs
Spot large deviations in GOP or room revenue
Detect missing data inputs
Then use Management Perspective to dig deeper
Drill into department-level or KPI-level details
Cross-check actuals vs. forecast
Identify which teams or departments are driving the issues
Take action
Flag any missing or delayed data
Alert department heads where adjustments are needed
Use this as your huddle agenda: “Here’s what’s red today and why”
The Management perspective is a consolidated report that gives the most complete picture for pin-pointing total and departmental performance, in terms of both revenue and productivity, month-to-date and month-end.
How is the revenue pacing for each department compared to Forecast, Budget or Last year, month-to-date and month-end?
How is productivity pacing so far this month compared to Forecast, Budget or Last Year and what does month-end look like?
When rows in the table or bars in the graph are red, the respective cockpit has not been saved for the last day(s).
You can check in the Flash Report if the registered revenue on your trial balance corresponds to what is recorded in PMI. If you import the rooms forecast, you can check your original file with what is recorded in PMI on future dates in the Flash report or Live forecast.
All the revenue and statistical codes in your PMS should have a corresponding account in PMI. It is important to ensure revenues are going to the right revenue center and the correct segment.
Trial Balance for Rooms should be mapped to the hotel and Total on segments.
PMS Reservation Statistics (restat) should be mapped to the hotel and the corresponding segment.
All hours logged in the timekeeping (or time and attendance) system are imported daily into PMI. These hours must be classified as either productive or non-productive.
See the guidelines below on how to categorize the imported hours in PMI.
Productive hours are any hours spent on performing core activities and core duties, i.e., those that are essential functions directly aligned with the primary mission of the respective departments. These are typically regular or routine tasks that form the core of the daily work in the respective departments.
Non-productive hours refer to paid hours when staff are not doing their core work tasks. This can include attending training sessions, participating in safety drills, and even time off for paid sick leave.
Time categories that the hotel doesn’t pay for should be set as “Ignored.”
In the housekeeping department, the core activities or tasks revolve around maintaining cleanliness and hygiene throughout the hotel. This includes daily room cleaning and preparation, sanitizing public areas, and reporting maintenance issues.
For the restaurant department, the core activities include regular meal preparation and service, inventory management, menu development, ensuring food safety, coordinating special events, and staff training.
The front office department serves as the primary point of contact for guests. Core activities encompass managing check-ins and check-outs, handling reservations, providing guest assistance, and managing accounts and payments.
Here are few examples to help make the use of these fields easy and correct.
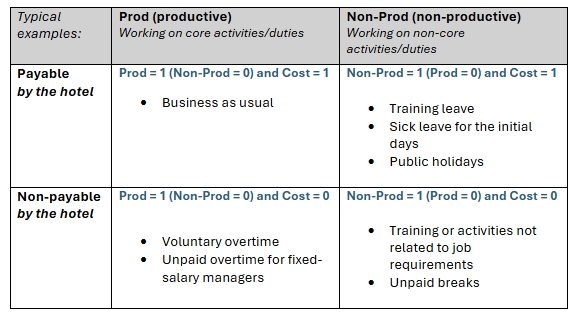
If a department does not appear in PMI, it is not registered in your TKS. Whenever a department or code is not mapped anywhere, there will be a warning on the PMI home page, and it will appear in red on the mapping list.
Each department and position can only be mapped to one place. If you need to split a position or shift, you need to do this in your Timekeeping system. If you want the split to appear in PMI only, you can use Schedule to make a shift code that deducts hours from one department and adds them in another. There are other ways of manually moving hours in PMI, but this will require additional daily work.
Categories in PMI are the different types of shift codes used in your Timekeeping system (TKS). Most TKS are connected to your payroll system and therefore need a detailed description of how you work for legal purposes. There will be different codes for regular daytime working shifts, evening, weekend, overtime, vacation, sick leave, paid or unpaid absence, parental leave, etc.
Departments refer to the cost centers in your property, where you have staff registered in the Timekeeping system. In PMI, the departments should be mapped to a specific Cockpit. In some Timekeeping systems, you will also have the departments split into positions. If each position should go to the same cockpit, the mapping on these should be on “none”, then all hours on these positions will go to the same Cockpit corresponding to the department. If a position should go to a different cockpit, map where you want the hours to be registered.
This is where you decide where departments and codes from your timekeeping system should go to which Cockpit in PMI.
The Mapping module is where the revenue and occupancy data (room nights, guest nights, covers, etc.) from the various source systems is imported to PMI. Usually there is very little maintenance of this module except in cases involving:
What items or accounts do I need to map?
All revenue, revenue corrections, and statistical accounts should be mapped in PMI. Statistical accounts are those related to occupied rooms and in-house guests, both actual and historical. Payment accounts, tips, VAT, deposits, commissions, and transfer codes should be ignored in PMI.
The spoon and fork icon are only available on interfaces with Revenue accounts.
Forecasting and OTB interfaces will not give the option to select Food Revenue.
Food segments are automatically marked as Food Revenue (the spoon and fork icon appears blue).
When the icon is grey, you can change it to Food Revenue by simply clicking the icon once.
1. Home – Labor cockpit productivity status tiles
2. Management Perspective – “Hours MTD / Month-end” table
3. RevPOLU (Home or Management Perspective)
4. GM Daily Digest – Key insights & Watchlist
5. PMI Adoption Index
Ignore technical-health tiles (Integration Status, Data-source Status) unless you’re troubleshooting missing data – they do not reflect team performance.
1. From the Profit & Loss page, go to Tools.
2. Click Account Templates & Categories
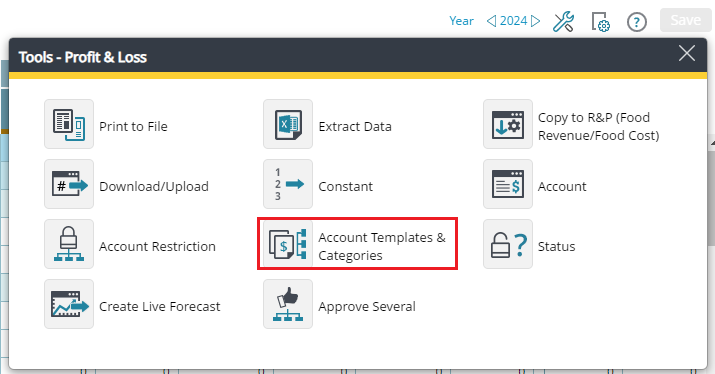
Image description: Tools menu in Profit & Loss
3. Download a template.
4. Select the template where you want to add the new account(s).
5. Click on the down arrow to download the current template data to an Excel file.
6. Add accounts to the template.
7. Open the Excel file.
8. Go to the first empty line.
9. Select columns A, B and E from the drop down list.
10. Fill in the correct information in Columns C & D.
11. Save the document.
Note: It is very important that you do not copy/paste but use the dropdown option where applicable. Type in the new code manually. Do not override existing codes unless you are 100% sure that you want to make the change.
12. Upload the template.
13. Click on the Up arrow to upload the template where the new accounts have been added.
• A list of all new accounts to be added will be shown.
14. If the list is correct, click Save/Upload.
15. Add account to P&L.
Note: This account needs to be added to the correct profit center in order to be able to map it.
16. Go to Tools.
17. Select Account.
18. Select the correct profit center as the source.
19. Select the category All.
20. Select Choose All
21. Type in the newly added account and press Enter.
22. Select the account from the list.
23. Click OK.
The account is now ready to map.
This function allows users to copy account data—such as forecast figures or formulas—from one department to another within the Profit & loss module. It is especially useful when setting up a new department, aligning similar outlets, or applying standard structures across properties.
Intended users:
Department managers, controllers, or anyone responsible for managing the Profit & loss forecast in PMI.
Access required:
Access to the Profit & loss module and Tools > Copy Account Data functionality. User must have permission to view and edit both the source and destination departments.
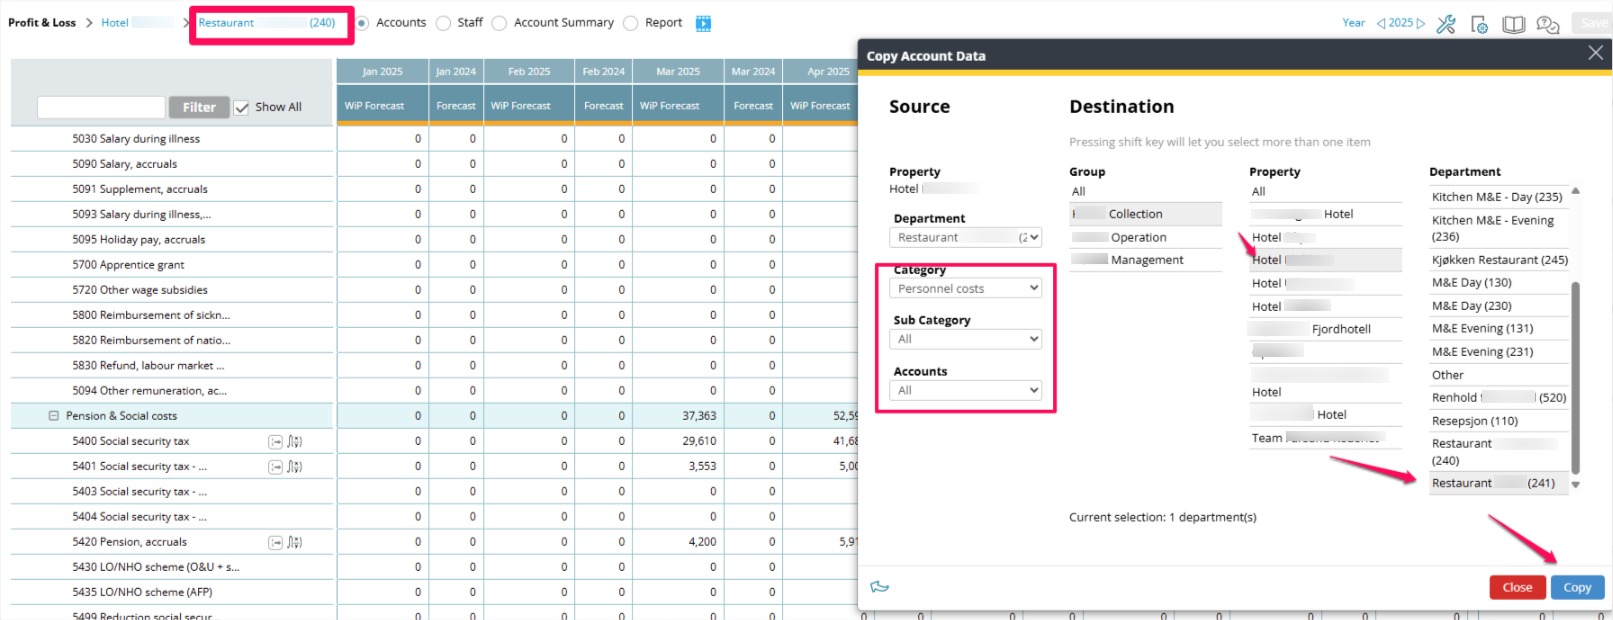
To copy from reference, go to the Profit & loss page.
To copy from reference, go to the Profit & loss page.
When viewing Reports in the Profit and Loss module, there are several view options. Click on the view options icon, then the pencil under Report Content. Tick the YTD box to see the accumulated WIP forecast from the beginning of the year until present.
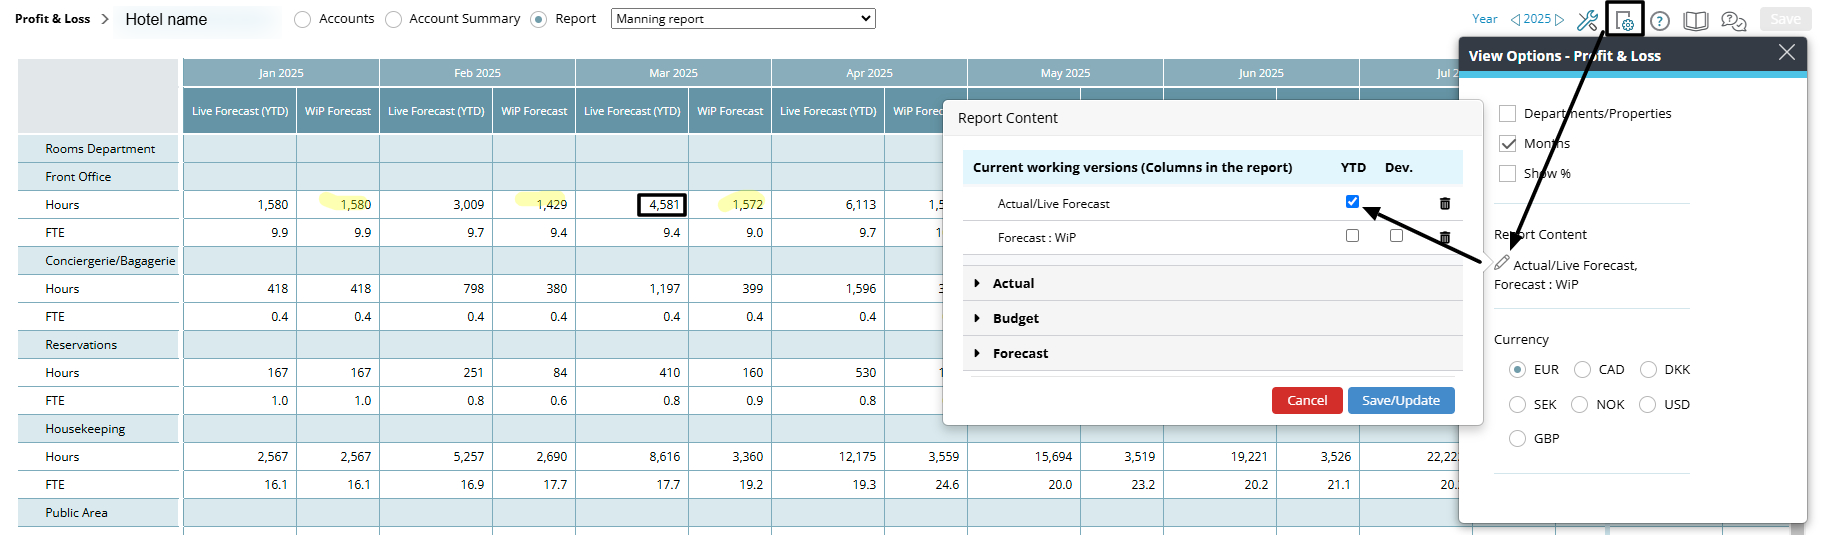
In the screenshot above, the accumulated WIP forecasts from January to March make up the year-to-date Live forecast for March. The year-to-date Live forecast for March will be added to the WIP forecast for April, to create April’s year-to-date Live forecast, and so on month by month.
If you’ve raised productivity targets and want to assess whether they’re leading to improved performance, here are the key steps to take:
Yes, if needed, you can create a shift code that divides the hours between different departments. Click on the link to see how you create an employee for several departments using a split shift code.
You can read more about split shifts in this article, Split shifts between departments.
To add workers (and their shifts) into multiple future months, use the Rotating Schedule feature. You can find this in the Tools menu.
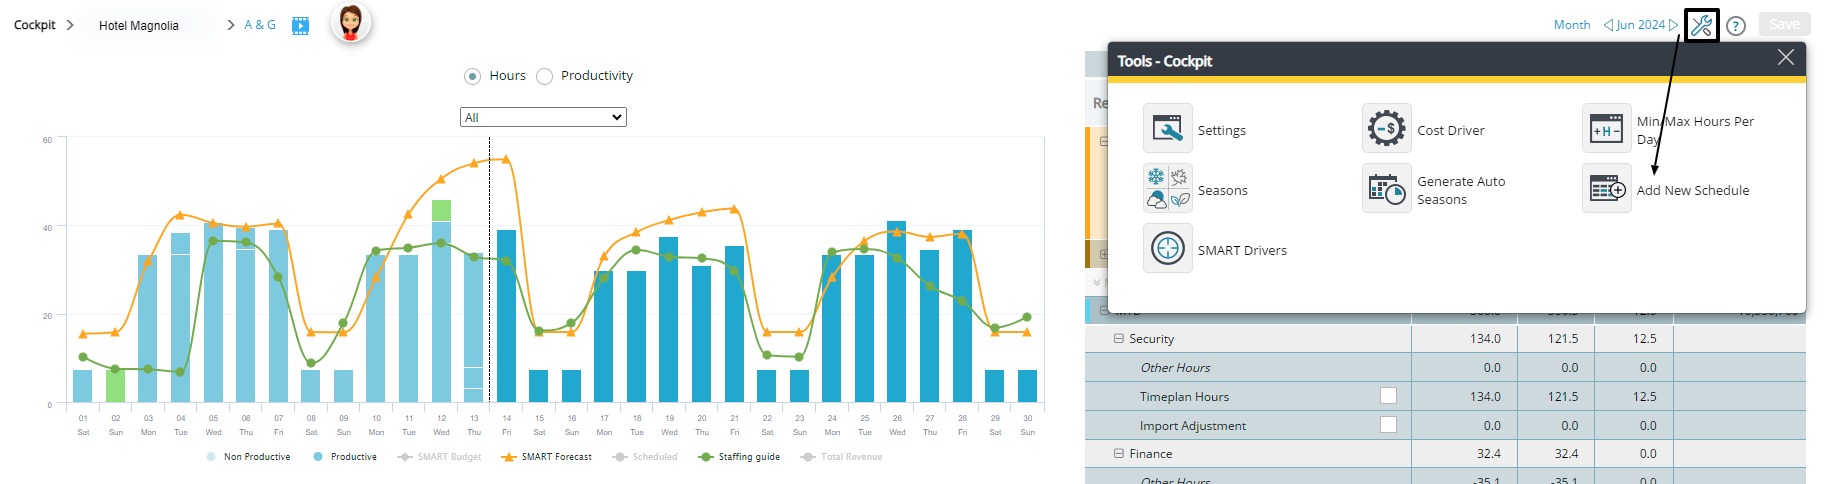
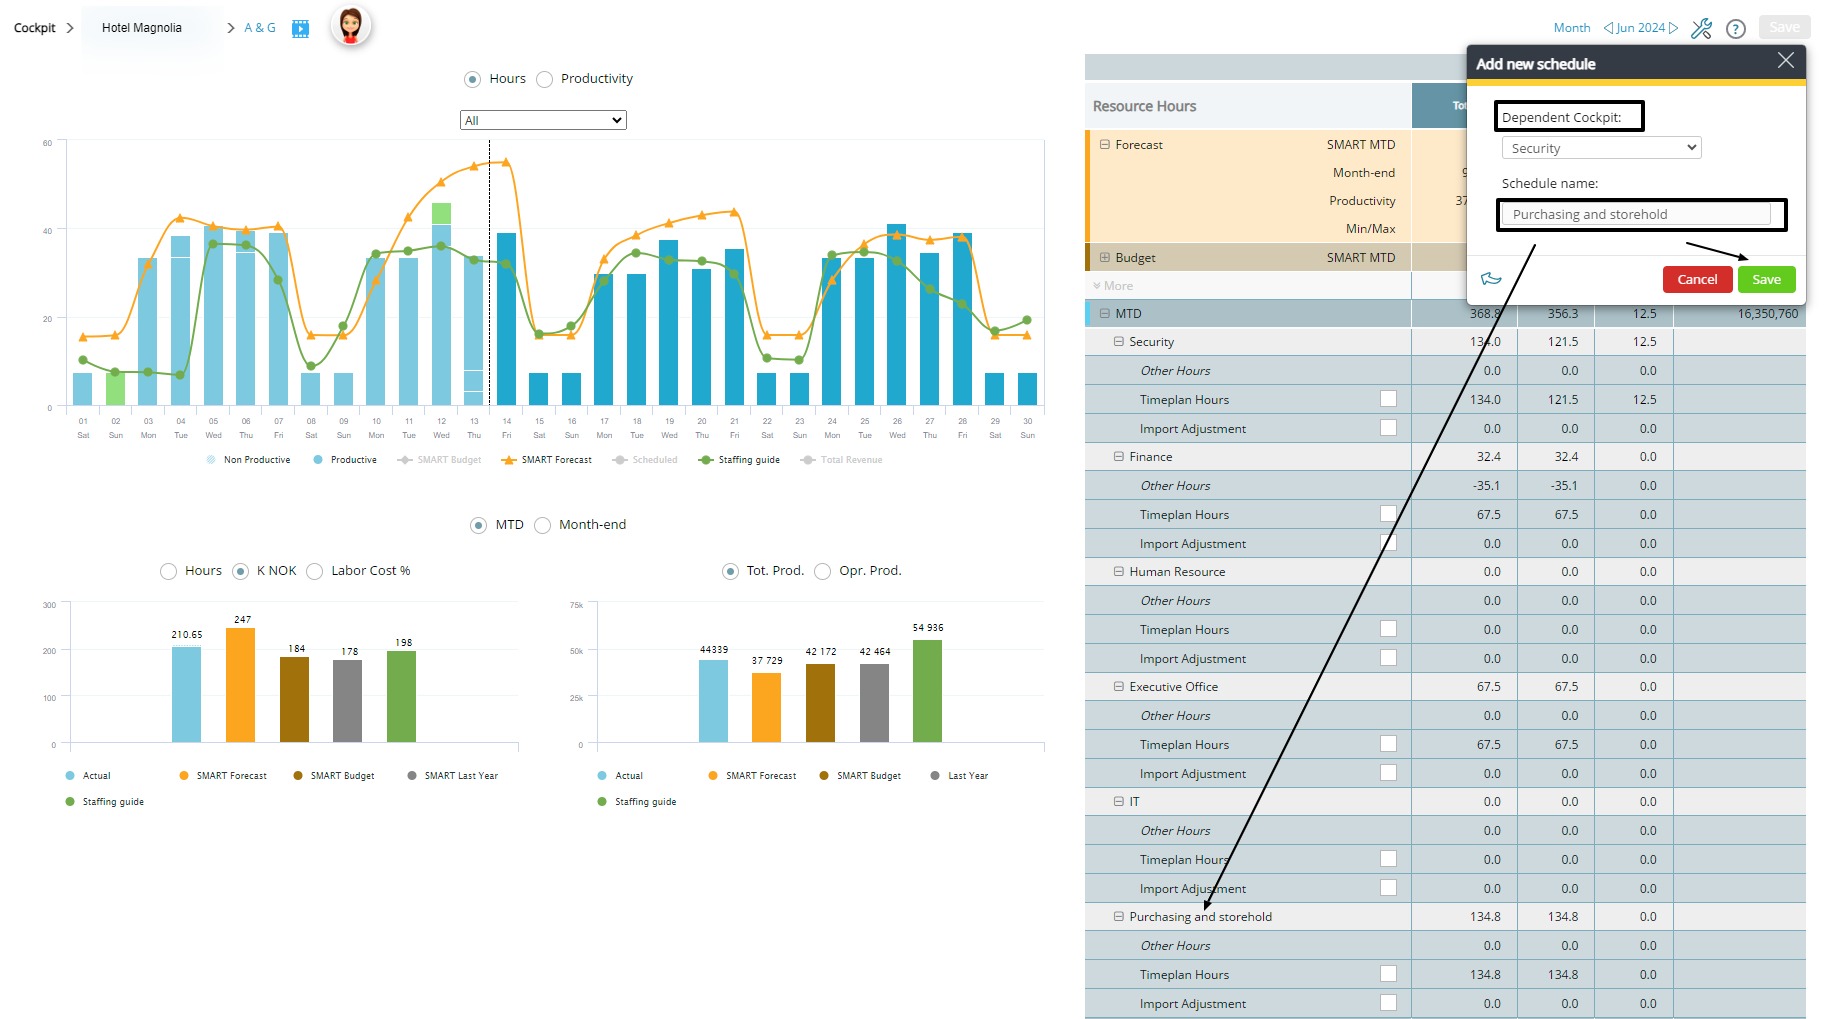
a. For a dependent cockpit, make sure you select the correct parent cockpit that this new schedule should be linked to. (You will have this option only if you are in a parent cockpit with dependent cockpits).
4. Insert the schedule name. For schedules linked to a dependant cockpit, the name is typically the same.
5. Click on Save to add the new schedule.
You may also find the video How to create a labor cockpit schedule in our Knowledge base helpful.
From the Schedule module, you can add, maintain and work with predefined shift codes. Click the Tools icon at the top right, then select Shift Codes, to see the options.
For indepth details about shift codes, please read this article Predefined shift codes.
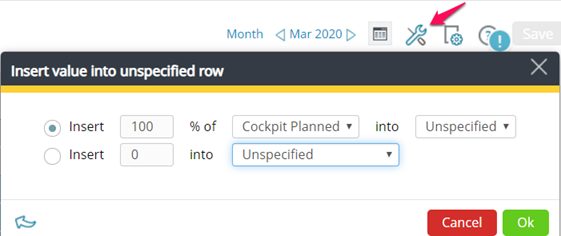
From the Tools menu in the Schedule module, choose to “Insert value into unspecified row”. This allows you to populate your schedule with different choices. A percentage of Cockpit Target or Cockpit Planned can automatically be inserted by using this function.
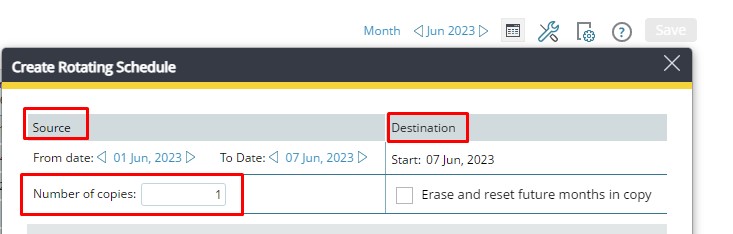
Creating a rotating schedule is a good option when you have a rolling schedule in place. This function lets you copy a schedule that you have created for the period you want.
Choose a period for which you have entered the schedule that should be repeated (must be a weekly period).
The start date will, by default, be the day after source date. Choose how many weeks ahead you want to copy to. (To copy one year ahead, enter 51 copies, if your source is one week.)
You can read this Scheduling article to learn more about creating a rotating schedule.
From the Tools menu in the Schedule (or Cockpit) module, you can choose Add New Schedule. You can have several schedules for one department/cockpit, but we recommend only one schedule in place to save time and effort.
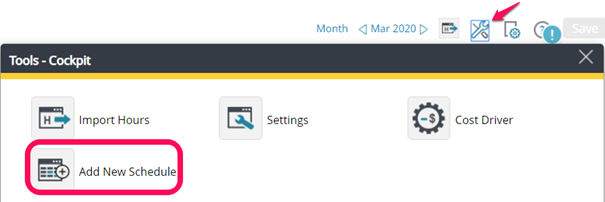
There are many different functions within the Tools menu in the Schedule module. All of them are described with a brief text. As a basic principle, what you see in the schedule is what is going to be exported to print.
For a detailed explaination of the different Tools options, please see this article, Schedule tools and view menu.
In the Schedule module near the bottom of the page is a row called Timekeeping system (TKS) excluded hours. If you have hours in the department that are not imported through the TKS, you can add the hours in this row. An example of this would be outsourced labor.

You should not delete or deactivate users from your property if they have access to other properties. This will remove their access to all other properties in PMI.
To remove a user’s access to your property, you should remove the property from their profile.
If a user has access to just your property and you want to remove his access, then it is safe to delete or de-activate.
How to remove user access to your property only:
1. Click on the pencil (Edit user tool) for the user in question.
2. Open the user roles by clicking on Show more in the User roles row.
3. Find the property that you want to remove access to, and click on the trash can.
4. Follow the steps to remove the property.
Related information:
To change your password, enter Settings from the main menu. Here you can edit settings and preferences, including changing your password. Click here to read more about user settings.
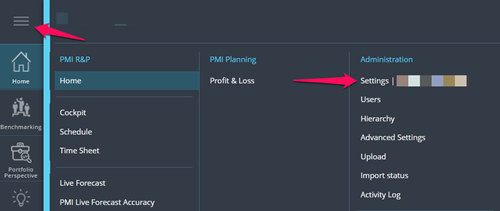
The Data Upload Centre is where you manually upload various types of data, including budgets, forecasts, actuals, CO2 factors and KPI targets.
Anyone with controller rights can access this feature.
Access the Data Upload Centre via the Administration column in the main menu.
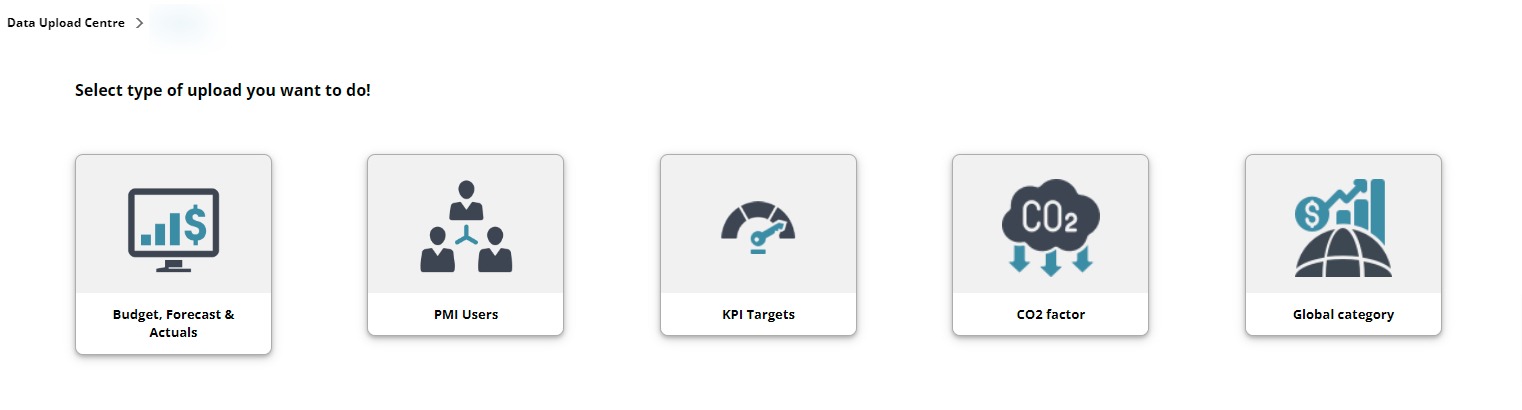
Image description: The Data Upload Centre in PMI
Create or download a template, or use a previously exported sheet.
See here for more information on the Data Upload Centre.
All user administration (adding, editing, and deactivating and deleting users) is done via the User Administration module, accessed from the main menu. You need user administration rights to make any changes. Contact your chain, your property’s PMI contact or Support if you don’t have the rights. Click here to read more about managing users.
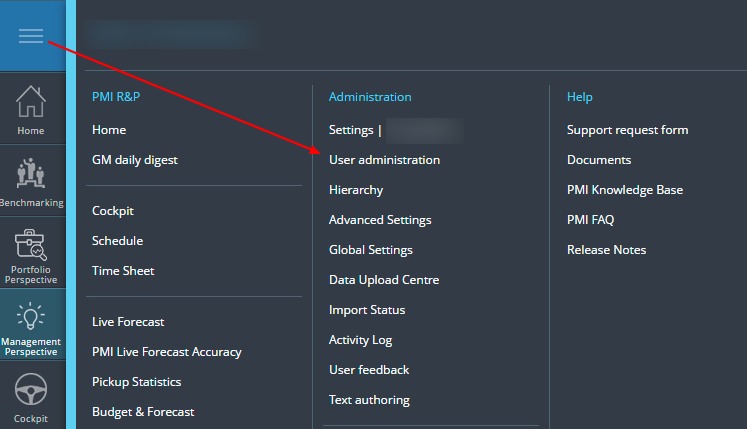
When a user leaves your property, you should remove their access through the User Administration module.
To delete a user:
Important:
If you select Deactivate, the user will be deactivated from all properties in the chain.
Use Delete if you only want to remove the user from your property.
Related article: Does deleting a user remove them from just our property or all of PMI?
User rights depend on what role and what department the user should have access to. You need to decide if the user needs editing rights or only view rights. Click on the below link to find the different user rights available to be assigned. Click here to read more about different user rights.
Allow Google Analytics cookies to help us understand which guides are useful. Your choice is optional. Privacy notice