Every day
1. Banner is green? Great – data’s in. If red, chase the missing file.
2. Progress bar colour:
- • Red bar → already over target → find the leak today.
• Amber bar → slightly above forecast → ask the team what changed.
• Green bar → on pace → no action.
3. Leave a one-line comment (“Boiler fault – gas up 18 % – engineer booked”).
4. Update your tasks (tick what’s done, add new fixes).
Every week
1. Scan the 12-month consumption chart
- Look for any resource line that is creeping up – tackle it before budget season.
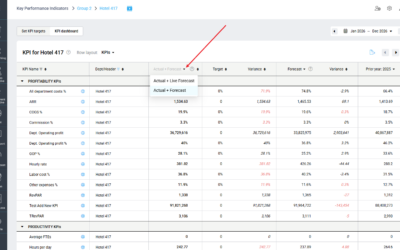
2. Export scores (Excel)
- Send the file to Engineering and the F&B cost controller.
- Agree who owns each amber/red variance.
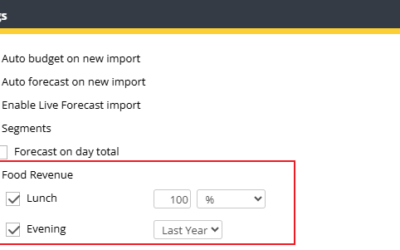
3. Update the SMART forecast if operations changed
- Big event cancelled? Enter a negative adjustment so the target resets and the team isn’t “over” for no reason.
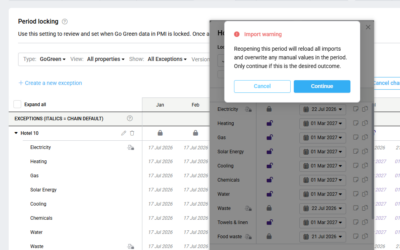
4. Tidy the cockpit
- Clear any lingering red banners (missing days).
- Archive completed tasks so only live actions remain.
5. Celebrate wins
- If the monthly bar is green and trending down, grab a screenshot and share it on the staff board – positive feedback drives future engagement.
Remember the order
- Data banner – proof the numbers are fresh.
- Progress bar – shows whether you are on pace.
- Comments – turn facts into context.
- Task-bank – turns context into action.